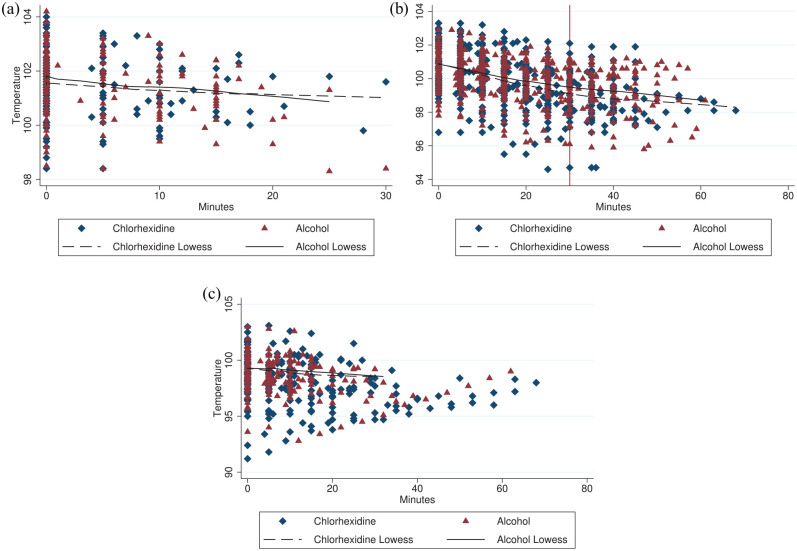
Figure 2.
Scatterplot of temperature (ºF) by minute for chlorhexidine (n = 79) and alcohol (n = 78) rinses by the phases (a) preparation, (b) surgery and (c) recovery overlaid with their respective locally weighted scatterplot smoothing (LOWESS) lines. Time 0 is the start of the respective phase. Vertical line at 30 mins in the (b) surgical phase demonstrates inflection point

