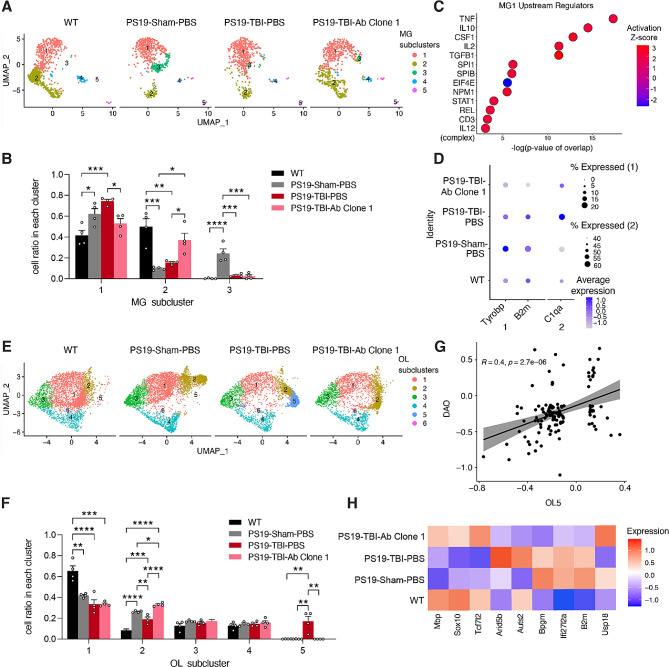
Fig. 5.
snRNA-seq reveals microglial activation and oligodendrocyte myelination impairment in TBI are rescued by anti-ac-tauK174 immunotherapy. (A) Subcluster analysis of microglia (resolution 0.15) between conditions: WT, PS19-Sham-PBS, PS19-TBI-PBS, and PS19-TBI-Ab Clone 1. (B) Bar graph of cell ratio per condition within each microglia cluster. ****p < 0.0001, ***p < 0.001, **p < 0.01, and *p < 0.05 by one-way ANOVA with Tukey’s multiple comparisons correction within each subcluster. (C) Ingenuity Pathway Analysis (IPA) upstream regulators of MG1 markers. (D) Percentage and average expression levels of disease-associated microglia (DAM) genes (Tyrobp, B2m), and cytokine gene (C1qa) across 4 conditions; scale, log2 fold-change. (E) Subcluster analysis of oligodendrocytes (resolution 0.2) between conditions. (F) Bar graph of cell ratio per condition within each oligodendrocyte cluster. ****p < 0.0001, ***p < 0.001, **p < 0.01, and *p < 0.05 by one-way ANOVA with Tukey’s multiple comparisons correction within each subcluster. (G) Simple linear regression analysis with standard error showing a positive correlation between OL5 markers and disease-associated oligodendrocyte markers (DAO) (R = 0.4, p = 2.7e-6). (H) Heat map of average expression levels of myelination-related genes (Mpb, Sox10, Tcf7l2), IFN-gamma hallmark genes (Arid5b, Auts2, Bpgm, Usp18), and IFN-responsive oligodendrocyte (IRO) markers (Ifi27l2a, B2m) across 4 conditions; scale, log2 fold-change

