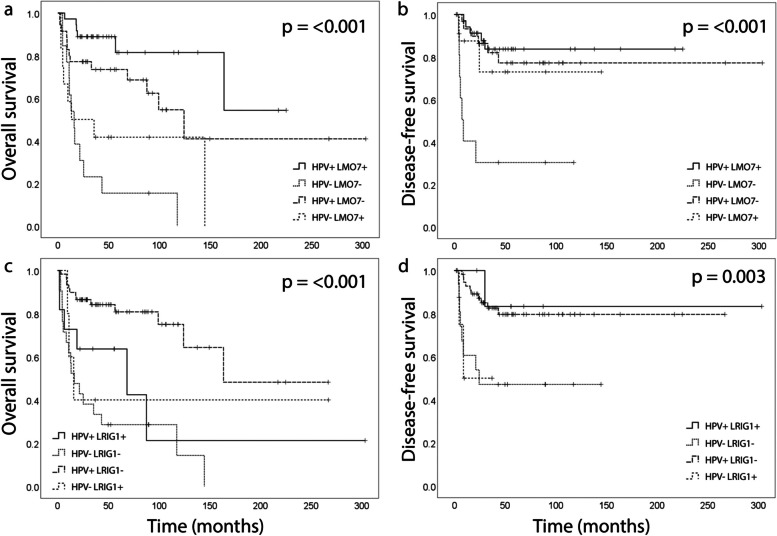
Fig. 3.
Kaplan–Meier curves showing overall survival (OS) and disease-free survival (DFS) in patients grouped according to the combined HPV and LMO7, or HPV and LRIG1 status, in the whole cohort. a and b comparing HPV-driven (HPV +) and LMO7 expression high (51–100%) (LMO7 +) tumors to non-HPV-driven (HPV-) and LMO7 expression low (0–50%) (LMO7-), and HPV-driven and LMO7 expression low, and non-HPV-driven and LMO7 expression high tumors, OS and DFS, respectively, n = 96. c and d comparing HPV-driven and LRIG1 staining intensity strong (LRIG1 +) tumors to non-HPV-driven and LRIG1 staining intensity no/weak/intermediate (LRIG1-), and HPV-driven and LRIG1 staining intensity strong, and non-HPV-driven and LRIG1 staining intensity no/weak/intermediate tumors, OS and DFS, respectively, n = 96

