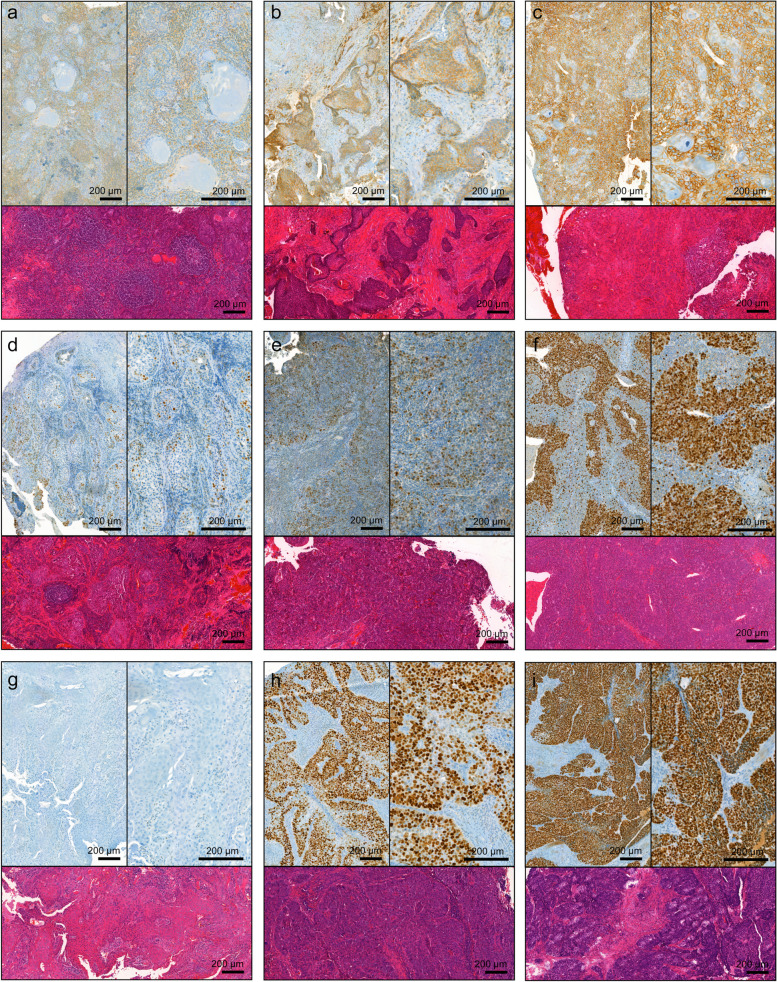
Fig. 4.
Microphotographs of representative tumor sections illustrating the hematoxylin and eosin staining and immunohistochemical staining of CD44, Ki67, and p53. CD44 staining intensity (brown) and percentage of positive cells; weak, 1–25% (a), intermediate, 26–50% (b), and strong, 51–75% (c). Ki67 percentage of positive cells (brown); 20% (d), 35% (e), and 95% (f). p53 staining intensity (brown); no staining (g), intermediate, 51–75% (h), and strong, 76–100% (i). Sections were counterstained with hematoxylin (blue). Scale bar 200 µm, 5 × and 10 × magnification

