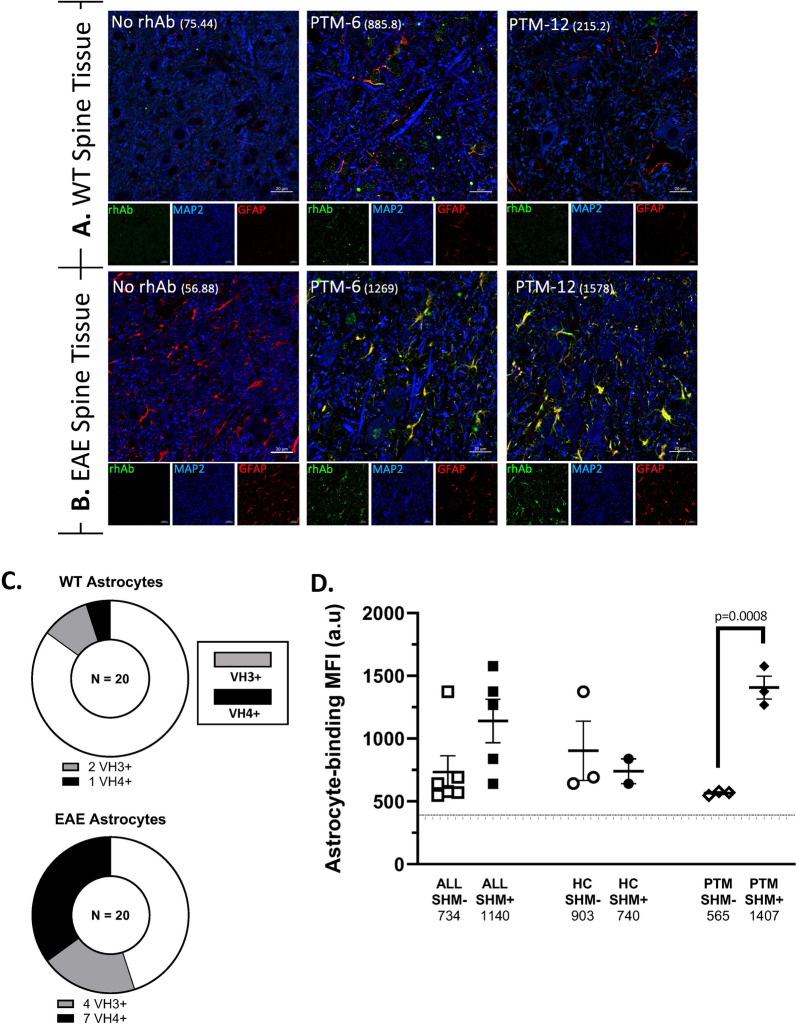
Fig. 3.
Plasmablast rhAbs bind neurons and astrocytes in mouse spinal cord. A, B Representative images of rhAbs binding neurons and astrocytes in the lumbar spinal cord of WT (A) and EAE (B) mice. Green: IgG staining. Red: GFAP. Blue: MAP2. In the merge panels, yellow indicates co-stain of GFAP with the rhAb. The MFI of astrocytic staining is indicated in parentheses. Scale bar: 20 μm. C Pie charts summarizing the number of rhAbs binding astrocytes in WT and EAE spinal cord tissue. D Scatter plots of the mean fluorescent intensity of the 11 astrocyte-binding rhAbs in EAE spinal cord tissue where the rhAbs are binned according to cohort (ALL, HC or ATM) and somatic hypermutation (SHM) accumulation status of the antibody heavy chain where “SHM−” indicates there is no SHM in the rhAb heavy chain and “SHM + ” indicates there is SHM in the rhAb heavy chain. Horizontal dashed line indicates the threshold of positivity which is set at 366.3. The average MFI of each cohort is provided below the x-axis

