
Figure 2. Comparative Hazard Ratios (HRs) of Target Vessel Failure by Glycemic Control Status and Imaging-Guided Stent Optimization for Patients With Diabetes Who Underwent Complex Percutaneous Coronary Intervention .
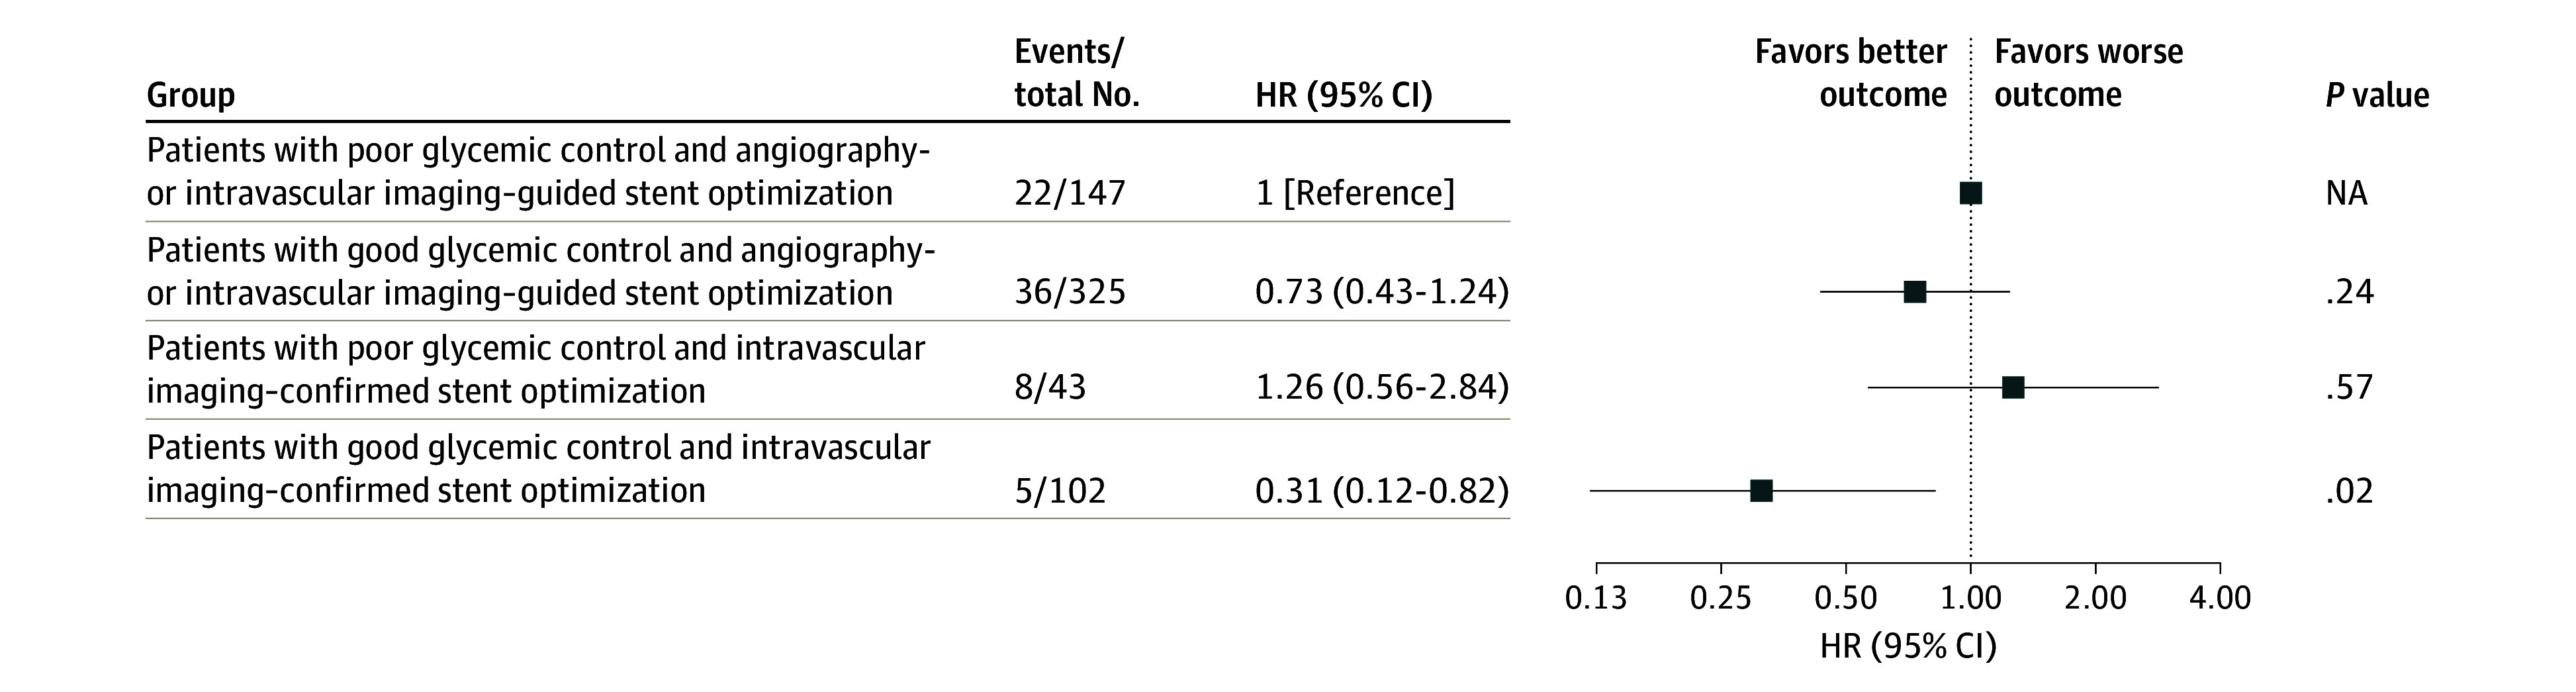
Error bars represent 95% CIs. Squares represent HRs. NA indicates not available.