Figure 3.

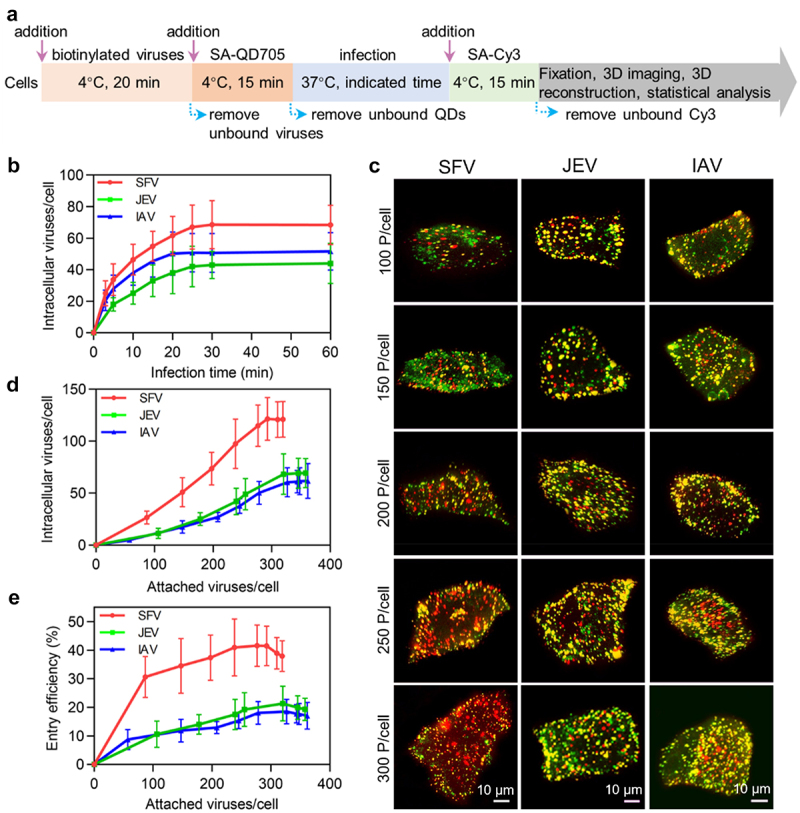
Quantitatively analyzing the efficiency of virus entry. (a) Flow chart for quantitative analysis of virus entry. (b) SFV, JEV and IAV were allowed to infect cells for 10, 20, 30, 40, 50 and 60 min. Then the cells were imaged in 3D and the number of viruses inside the cells was determined with ImageJ (n = 50). (c) Different amounts of viruses were allowed to bind to cells, labeled with QD705 (red), and allowed to infect cells for 30 min. The viruses remained on the cell surface were then stained with Cy3 (green). After that, the cells were imaged in 3D. The panels were the z-projection images of the cells. The red spots were intracellular viruses and the yellow were extracellular viruses. (d) Different amounts of viruses were allowed to be attached to cells. And the number of viruses entering cells after infection for 30 min was counted (n = 50). (e) The entry efficiencies of viruses (n = 50).
