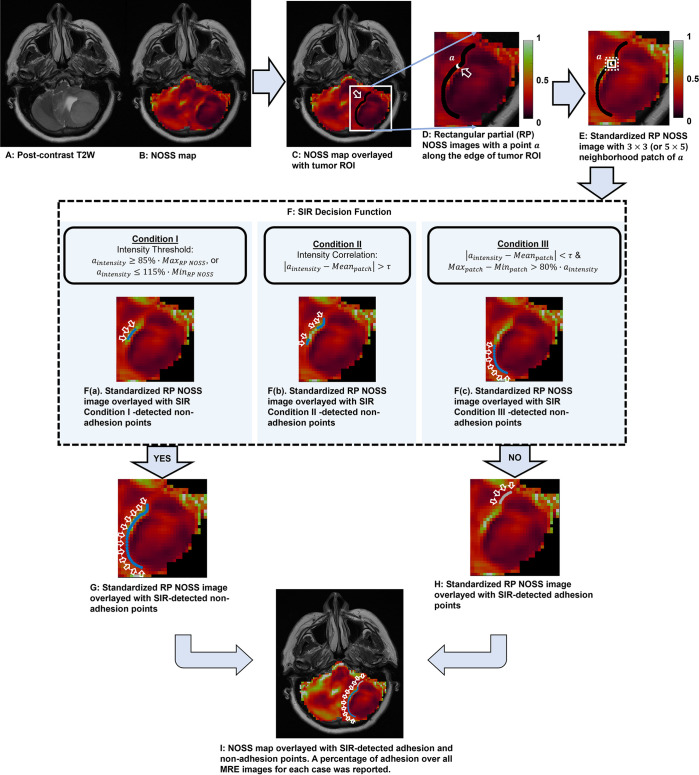
Fig 1. Flowchart illustrating the process of slip interface recognition (SIR) for a case of left posterior fossa meningioma (62-years-old, female), which is non-adhesion of surgical adhesion grading.
(A) T2-weighted image of the tumor. (B) The corresponding NOSS map. (C) Tumor ROI overlaid on the NOSS map, indicated by a black line in the white rectangle. (D) Extraction of rectangular partial (RP) NOSS images by extending 3 pixels (or 5 pixels) in the horizontal and vertical directions beyond the tumor ROI boundary. (E) Standardization of the intensity of RP NOSS images. For each point a along the edge of the tumor ROI, a neighborhood patch was identified with a default size of 3×3 (white square) or increased to 5×5 (white dashed square). (F) Non-adhesion at each point was determined by the SIR Decision Function with a value of “Yes” if any of the three conditions were met. Non-adhesion points determined by the SIR decision function Condition I, II, or III exclusively, were represented in F(a), F(b), and F(c), respectively. The non-adhesion points were depicted the blue line on the standardized RP NOSS image, indicated by white arrows. (G) All non-adhesion points (blue line) and (H) adhesion points (grey line) determined through the combination of points identified by the SIR decision function under Conditions I, II, and III. (I) SIR automatically classifies the non-adherent (blue line) and adherent (light gray line) interfaces and calculates the non-adhesion and adhesion percentage over the 3D tumor surface (37.71% of adhesion percentage in this case).

