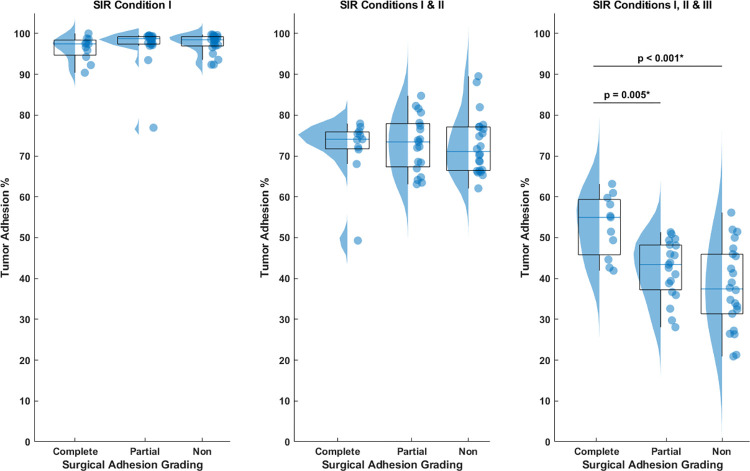
Fig 2. Raincloud plots comparing the tumor adhesion percentage based on surgical adhesion grades when using different SIR conditions.
(a) Application of solely SIR condition I, or (b) both conditions I and II failed to differentiate among the three tumor categories based on tumor adhesion percentage. (c) Employing all three SIR conditions reveals that complete adhesion tumors exhibit a higher tumor adhesion percentage compared to partial and non-adherent tumors.

