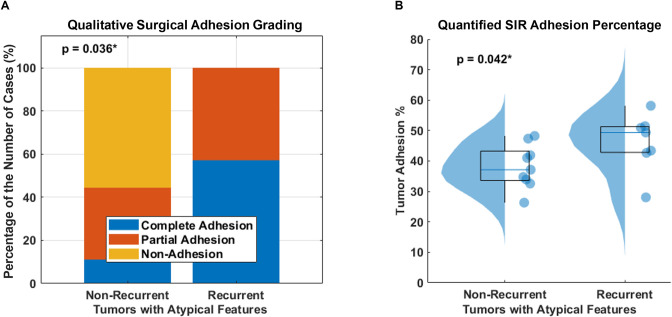
Fig 5. Group comparison between non-recurrent and recurrent tumors with atypical features.
(a) Stacked bar charts show the percentage distribution of the number of each qualitative surgical adhesion grading with atypical features, and (b) SIR-derived tumor adhesion percentage with atypical features.

