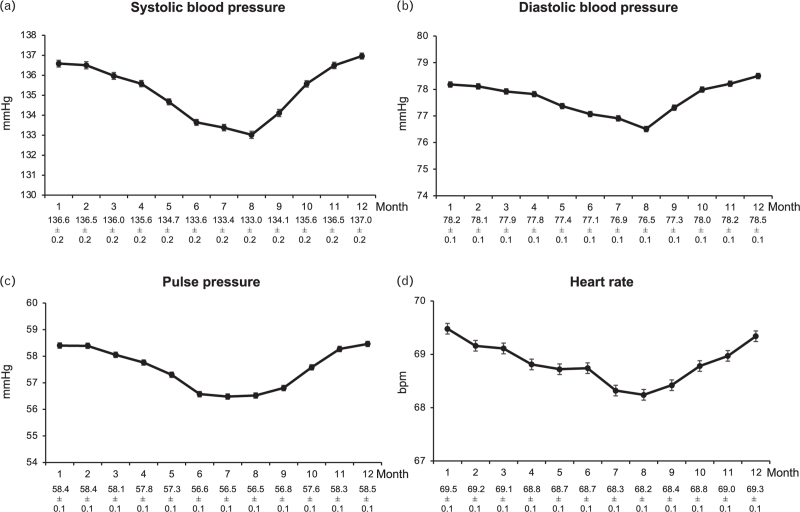
FIGURE 2.
Monthly systolic BP, diastolic BP, pulse pressure and heart rate values in the patients of Fig. 1 pooled (n = 25 390). Data of patients from the southern hemisphere were corrected for inverse seasonality (see Methods). Explanations and abbreviations as in Fig. 1.

