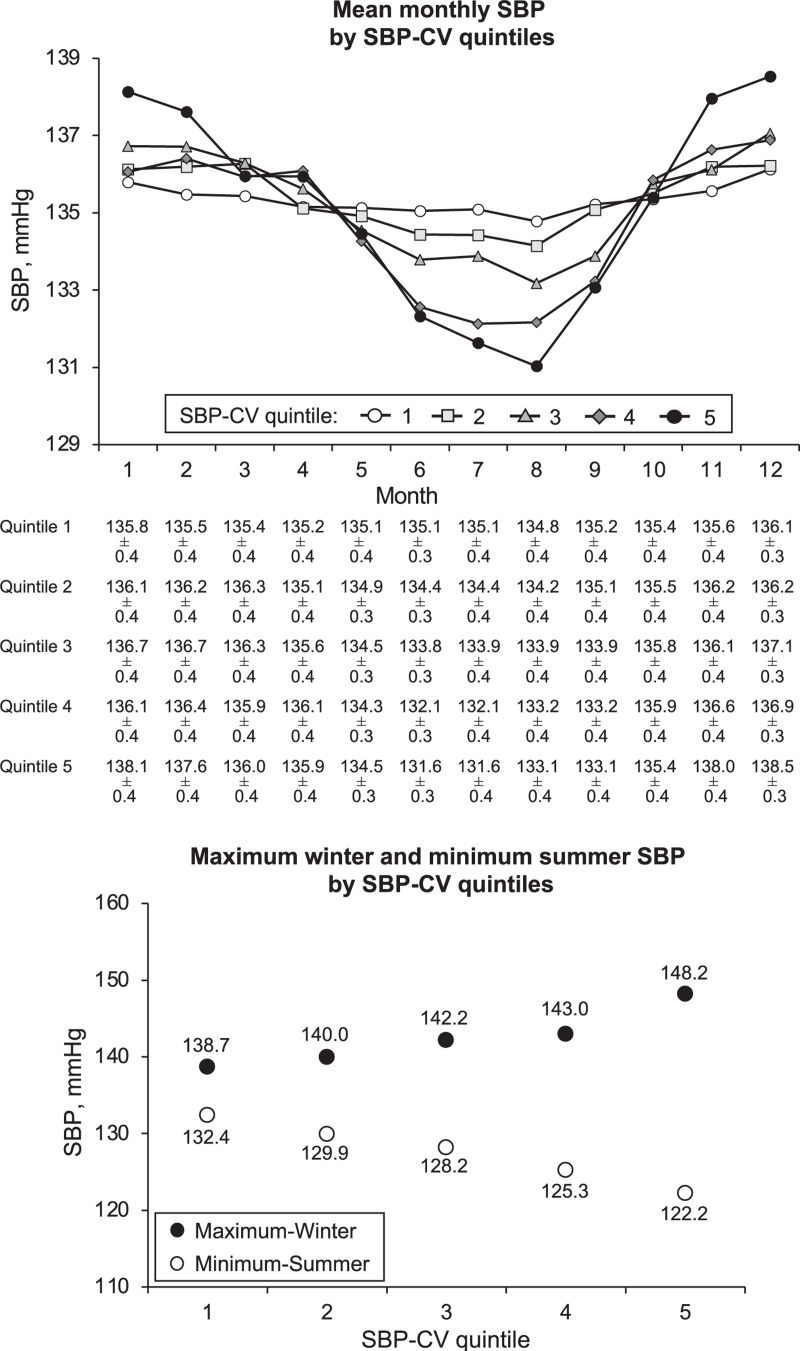
FIGURE 4.
The upper panel shows the mean monthly SBP values in different SBP-CV quintiles, i.e. from the lowest (1) to the highest one (5). The lower panel shows the mean maximum winter and mean minimal summer SBP values according to the SBP-CV quintile 1 to 5. Data from the 25 390 patients of the preceding Figures. Abbreviations as in preceding figures.

