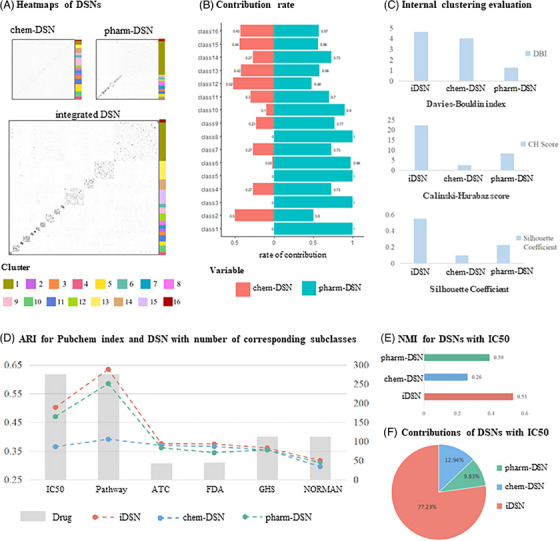
FIGURE 2.

Clustering validation and feature contribution of DSNs. (A) Heatmaps of DSNs. chem‐DSN and pharm‐DSN were integrated into the iDSN. The sidebar to the left of the networks corresponds to the cluster label. (B) Structural features used alone were defined in the stem‐and‐leaf display with drug clusters to evaluate their respective contributions. (C) Categorical internal evaluation by Davies–Bouldin index, Calinski–Harabaz score and Silhouette coefficient for chem‐DSN, pharm‐DSN and iDSN. (D) Categorical external evaluation by adjusted RAND coefficient for chem‐DSN, pharm‐DSN and iDSN based on multiscale drug classification annotations. (E) Normalised mutual information bar chart of chem‐DSN, pharm‐DSN and iDSN with IC50‐based benchmark drug classification separately. (F) Data types contribution defined in the pie chart include chemical structure, drug targets and fusion value.
