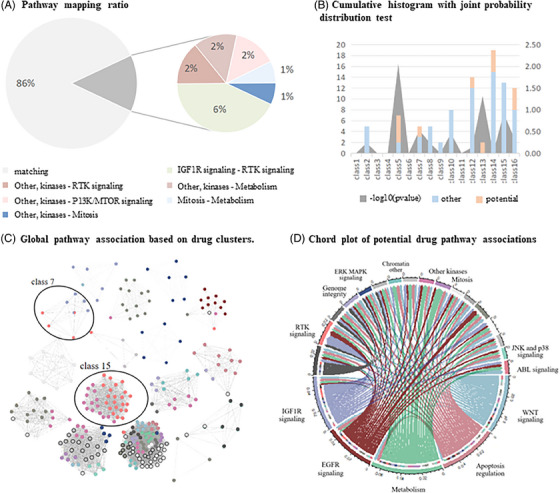
FIGURE 4.

Repositioning association with the different pathway. (A) The consistent distribution of the top 100 similarity drug pairs on the pathway and the proportion of different pathway pairs. (B) The cumulative frequency histogram calculated the corresponding consistent pathway and nonconsistent pathway in the cluster under the distribution of the top 100 highly similar drug pairs in the drug cluster. The area plot represents whether the set of consistent and non‐consistent paths under each cluster evaluates the p‐value after taking the negative logarithm of the significance difference. The corresponding frequencies are represented by the left ordinate while the statistical test index is represented by the right. (C) The global anti‐tumor drugs in the iDSN are grouped into 16 clusters. Node colour signifies the pathway assignment of the drug. (D) Pathway association network for global drug mapping. The peripheral ring represents the GDSC drug annotation pathway, and the arc length is determined by the central angle corresponding to the proportion of the drug counts included in the pathway. The lines represent inconsistent pathways mapped under 276 drug global associations. The inner ring represents the potential pathway of the drug on the outer circumference of the same radius. The colour‐indicated pathways correspond to inconsistent pathway‐source drug pairs with a similarity greater than .7, and the grey‐indicated pathways correspond to highly similar drugs that are all mapped on the same pathway.
