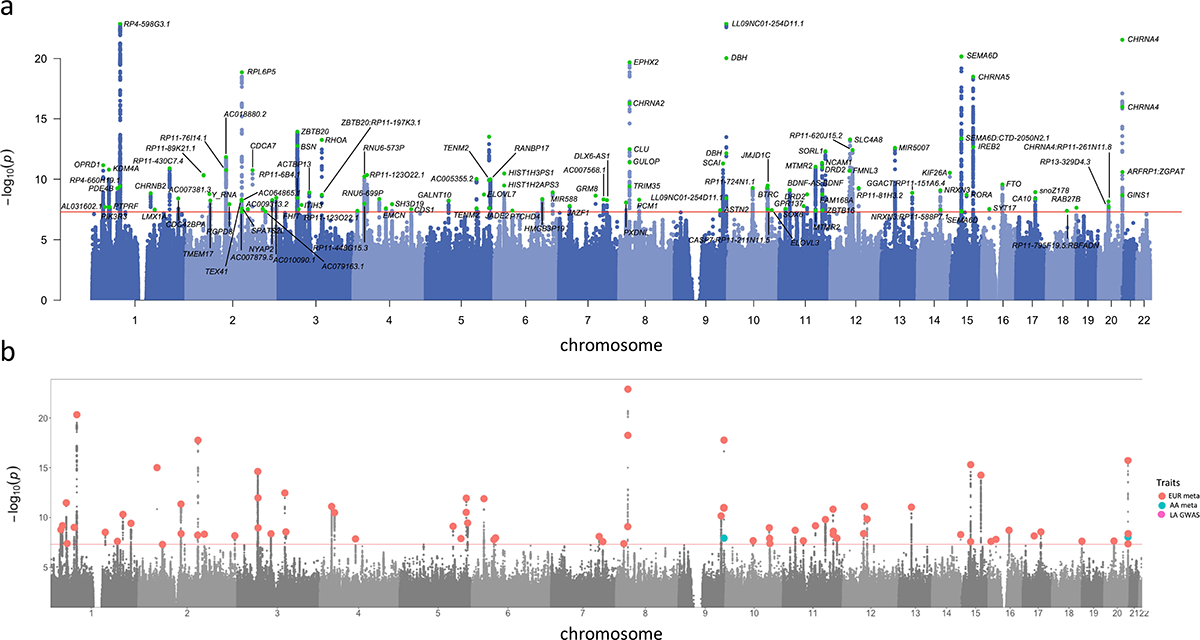
Figure 2. Manhattan and porcupine plots for the TUD-multi meta-analysis and ancestry-specific GWAS.

(a) TUD-multi identified 88 independent risk loci, all of which were recently identified by the GSCAN study. (b) Porcupine plot of ancestry-specific meta-analyses identified 63 loci in the European cohort (EUR, in red), and 2 loci in the African-ancestry cohort (AA, in blue). No significant associations were detected in the Latin American-ancestry (LA) cohort. We used a sign test to examine the 74 EUR lead SNPs in the AA and HA cohorts, of which 57 and 53, respectively, were directly analyzed or had proxy SNPs in these populations (Supplementary Table 10). Most SNPs had the same direction of effect in both populations (AA = 45 out of 57, HA = 41 out of 53; sign test AA p = 1.31E-05, LA p = 8.17E-05; Supplementary Figure 5). All statistical tests used were two-sided.
