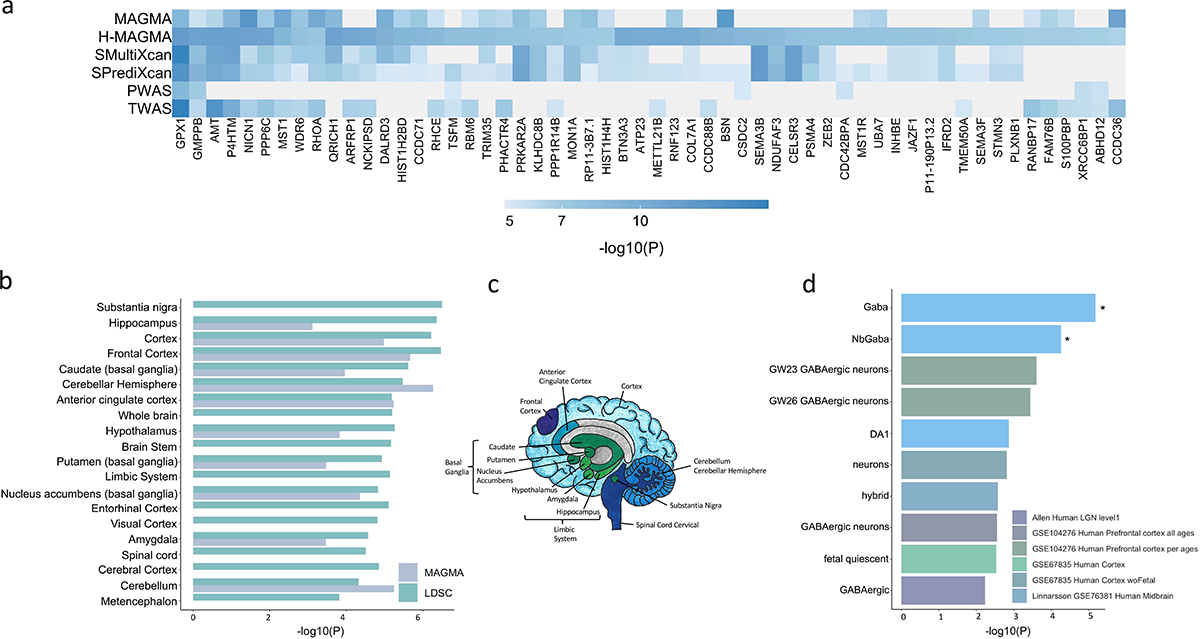
Figure 3. Integration with functional genomic data implicated 461 unique TUD candidate risk genes.

(a) Of 461 associated genes, 56 converged with at least 3 methods, and were dispersed throughout the chromosomes. (b) LDSC (SNP-based) and MAGMA tissue-specific gene expression of TUD risk genes reveals substantial brain enrichment (Supplementary Tables 25–26). Only tissues that survived multiple testing are plotted (MAGMA, two-sided p < 9.26E-04, LDSC, p < 2.44E-04). (c) The genetic findings across multiple levels of analysis (LDSC, MAGMA, MultiXcan, BrainXcan) implicated brain regions exhibiting anatomical differences in cases. (d) Cell type-specific expression of TUD risk genes. Results from MAGMA property analyses and gene expression using human single-cell RNA-sequencing datasets (Supplementary Table 28 for full list). After multiple testing correction for all datasets, only genes expressed in GABAergic neurons were associated with TUD (Supplementary Table 28).
