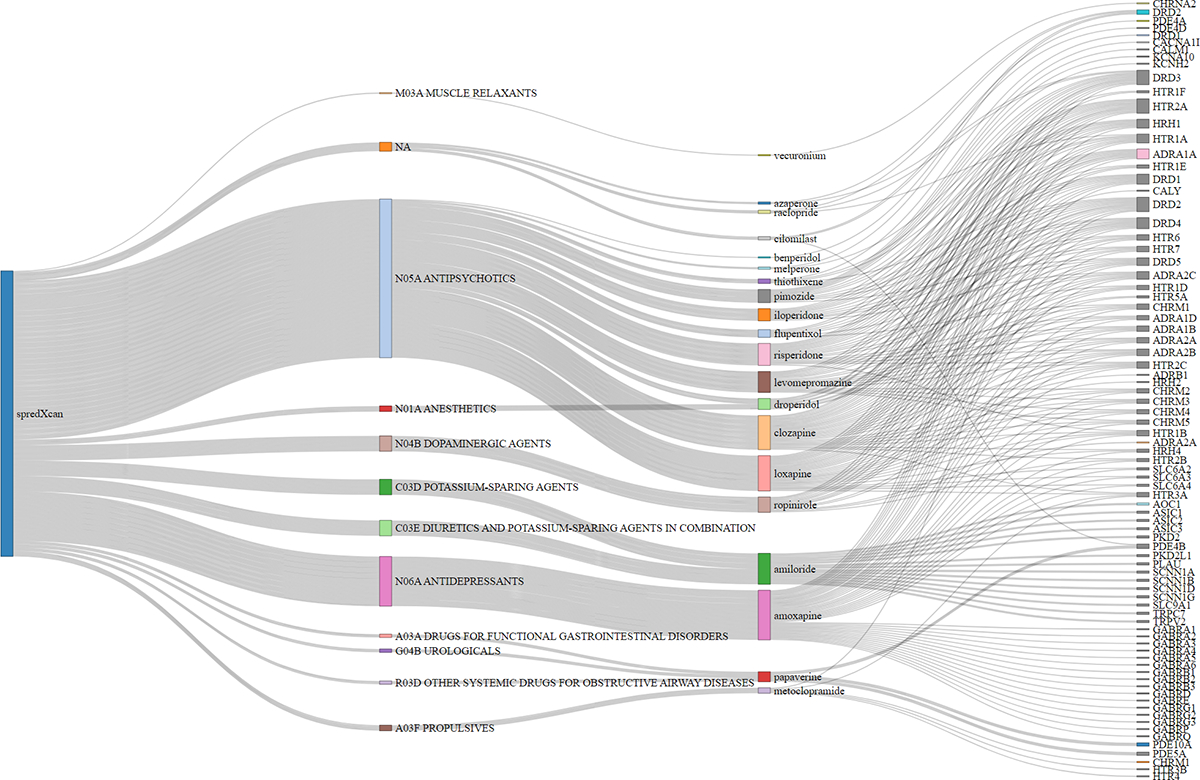
Figure 4. Sankey Diagram showing drug repurposing results from S-PrediXcan brain tissues.

20 medications/perturbagens grouped by ATC category membership from the Library of Integrated Network-Based Cellular Signatures (LINCS)36 database. ATC categories connected to perturbagen edges represent corresponding ATC category membership. Perturbagens connected to gene target edges are associated with the reversal of the TUD transcriptomic profile from S-PrediXcan brain tissue results. Only medications that targeted at least one mapped/independent gene from our GWAS are plotted.
