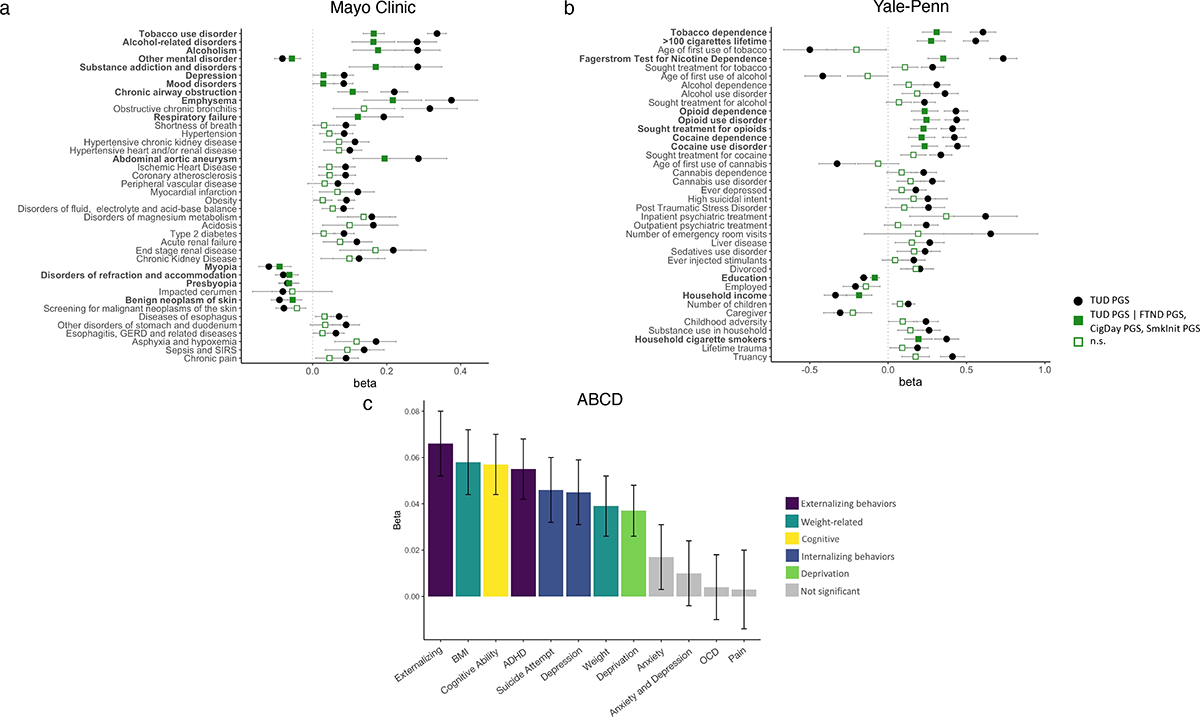
Figure 6. TUD PGS PheWAS in the (a) Mayo Clinic, (b) Yale-Penn, and (c) ABCD European cohorts.

Only selected Bonferroni-significant traits are shown. In (a) and (b), association of TUD PGS (in black) is conditioned on PGS for FTND, CPD, and SmkInit (in green).Values represent betas and standard errors. The exact values for each association and extended lists of traits can be found in Supplementary Tables 34, 36 and 38. The number of observations used in panel c is shown in Supplementary Table 38.
