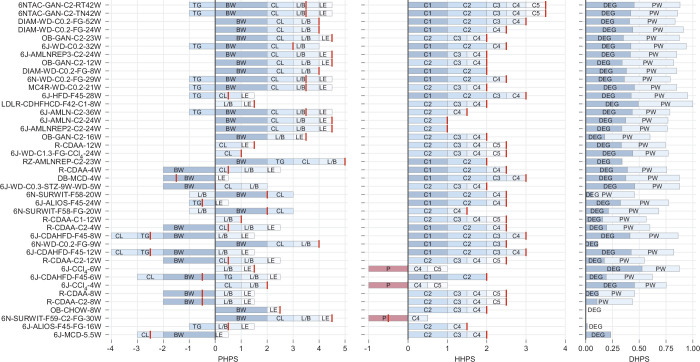
Extended Data Fig. 3. Details of the MHPS components (PHPS, HHPS, DHPS) – Metabolic Relevance.
Bar plots show the detailed composition of the MHPS components (PHPS, HHPS, and DHPS) utilised for the output focusing on metabolic relevance. Models are ordered globally according to the MHPS, where each barplot gives an overview of the total PHPS, HHPS or DHPS, the associated features, and their corresponding scores (see Supplementary Tables 5 and 6 and Supplementary Fig. 4 for an overview of the scoring strategies). For each model, the total scores of PHPS and HHPS are represented by red vertical lines to overcome the fact that some features are scored negatively. For PHPS and HHPS, the length of the stacked bars represents the scores’ absolute values (before normalising to the interval 0-1). DHPS directly shows the normalised score. Feature scores included are abbreviated as follows: PHPS: BW = Body weight, TG = Triglycerides, CL = Cholesterol, L/B = Liver Weight/Body weight (%), LE = Liver enzyme levels of ALT & AST; HHPS: C1 = Topography of histological lesions, C2 = Type of steatosis, C3 = Hepatocyte ballooning, C4 = Lobular inflammation, C5 = Mallory-Denk bodies; DHPS: DEG = Differentially Expressed Genes, DRP = Differentially Regulated Pathways.

