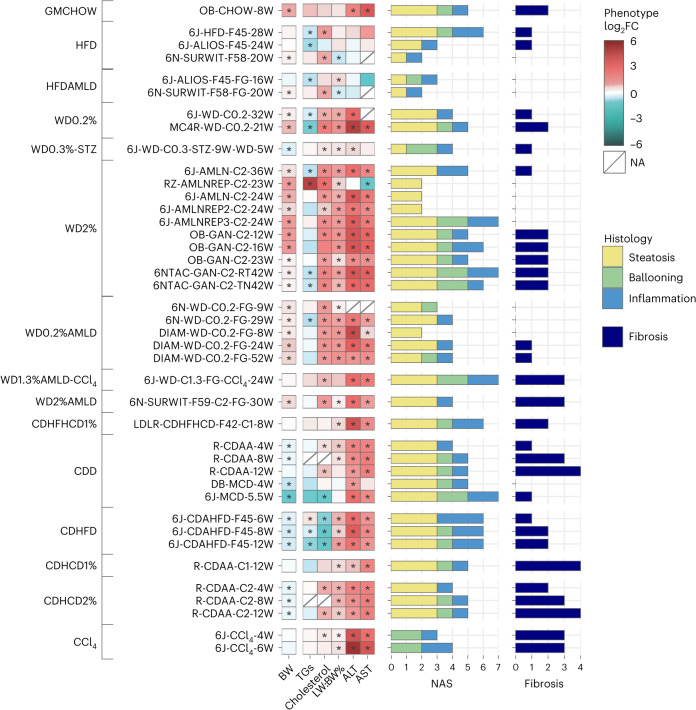
Fig. 2. Phenotypic and histologic characterization of the models.
Phenotypic changes observed in the MASLD models compared to their matched controls were profiled as the log2 fold change (log2FC) across measures of BW, blood triglycerides (TGs) and cholesterol, LW:BW% ratio, and ALT and AST. The red–blue color gradient indicates the level of increase–decrease of the measure in the MASLD models compared to their controls, while an asterisk indicates a significant change at P < 0.05 (two-sided Mann–Whitney U-test). The two panels of horizontal bars give an overview of the complete histological profiles, in which the total length indicates the activity score (CRN NAS) and fibrosis25. In addition, NAS components (steatosis, ballooning and inflammation) are represented by the stacked bar (yellow, green and blue, respectively) lengths. All models are grouped according to their macro-categories (detailed by the leftmost annotations).

