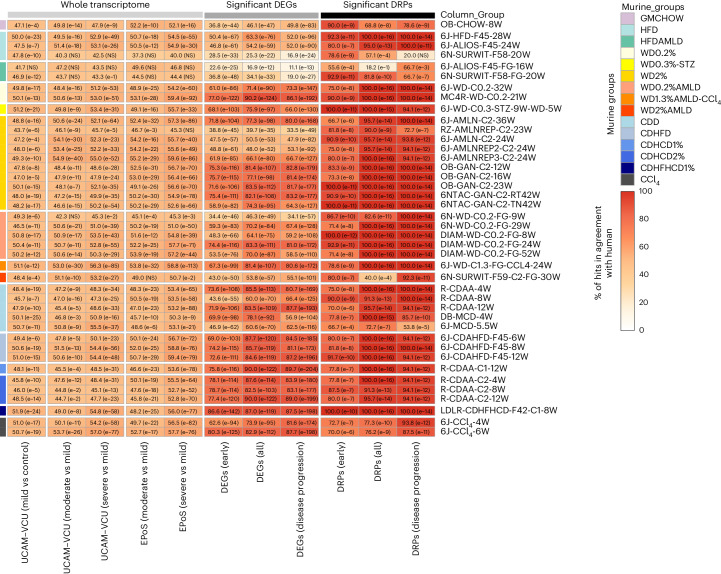
Fig. 4. Agreement of murine DEGs and DRPs with human MASLD.
Heatmap showing the agreement between murine MASLD models and human data based on the list of significant DEGs, DRPs, or the whole transcriptome. The percentage (%) of agreement between murine and human datasets defines the proportion of DEGs and DRPs statistically modulated and in the same direction compared to the human reference datasets (defined for ‘early disease development’, ‘all disease stages’ and ‘disease progression’ comparisons) or the proportion of DEGs statistically modulated and in the same direction compared to the human disease stage comparisons (defined for the whole transcriptome). All models are grouped according to their macro-categories as indicated in the graphic legend of the figure. Data are represented in a color-scale matrix showing the percentage of agreement and refer to DEGs (Supplementary Table 4; whole dataset or genes defined for ‘early disease development’, ‘all disease stages’ and ‘disease progression’, respectively) and DRPs (Fig. 3). In parenthesis, we show the results of the hypergeometric test (one-sided) performed on the same comparison groups, indicating the statistical significance (NS, non-significant (P > 0.05)).

