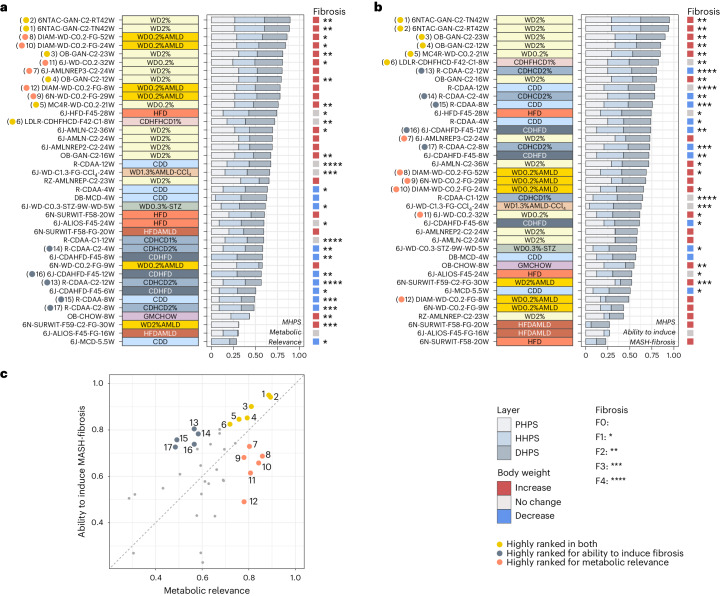
Fig. 6. The MHPS—metabolic relevance and progressive MASLD.
a,b, Comparison of the MASLD models, performed based on the MHPS that incorporates the PHPS (details in Supplementary Table 5), the HHPS (details in Supplementary Table 6) and the DHPS (see Supplementary Fig. 4). The average of these normalized scores (MHPS) ranks the murine models (from high to low) based on their metabolic relevance (a) or their ability to induce MASH-fibrosis (b). A detailed description of the different components is provided in Extended Data Figs. 3 and 4, respectively. For both a and b, the total length of the horizontal bars indicates the MHPS, while the length of the stacks within each bar indicates the relative contribution from the three evidence layers: PHPS, HHPS and DHPS. A reference panel to the right indicates BW (significant increases in red; decreases in blue) and fibrosis score (*). Macro-categories are indicated by the color panel to the left of the plots. c, Correlation among the two MHPS outputs (‘metabolic relevance’ vs ‘ability to induce MASH-fibrosis). Specific models are highlighted based on their performance within the two rankings. Yellow dots represent models that score high with both rankings and represent the best approximation to human MASH. Red dots are models that score highly for metabolic relevance but are less relevant for MASH-fibrosis. Grey dots are models that score highly for MASH-fibrosis but have less metabolic relevance. Panels a and b provide a specific reference to the position in the scatter.

