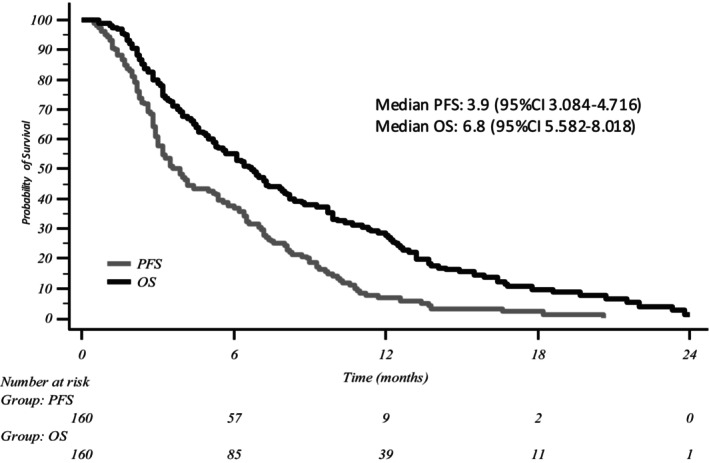
FIGURE 1.

Kaplan–Meier curve for overall survival and progression free survival in the entire population (N = 160). OS, overall survival; PFS, progression free survival.

Kaplan–Meier curve for overall survival and progression free survival in the entire population (N = 160). OS, overall survival; PFS, progression free survival.