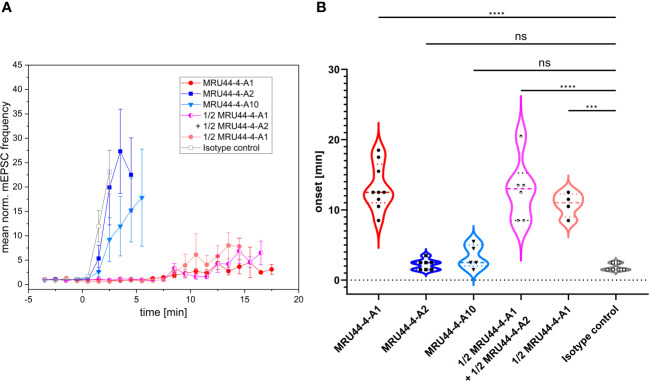
Figure 4.
Effect of selected antibodies onto α-LTX-induced increase of vesicular release. (A) Mean normalized mEPSC frequencies in cultured cortical neurons before and in the presence of a mixture of α-LTX and different antibodies or antibody combination. Error bars represent the standard deviation of multiple measurements (MRU44–4-A1: n = 9; MRU44–4-A2: n = 7; MRU44–4-A10: n = 5; MRU44–4-A1 + MRU44–4-A2: n = 6; 1/2 MRU44–4-A1: n = 4; STE90-C11: n = 6). After establishing a stable baseline recording period (4 minutes) preincubated extracellular solution supplemented with 1 nM α-LTX and 10 nM of respective antibody was washed in through the perfusion system (start of wash-in at time point 0). For antibody combination 5 nM per antibody and for 1/2 MRU44–4-A1 only 5 nM antibody was used. (B) Mean and individual onset times of α-LTX-induced pathogenic effect. For each cell the onset time was set as time point when the mEPSC frequency exceeded 4xSD of the mean mEPSC frequency before wash-in. For MRU44–4-A1 and combination of MRU44–4-A1 + MRU44–4-A2 in three and one single cell measurement, respectively, mEPSC frequency did not reach 4xSD during recording time. In these cases, onset time was set to the time the recording ended. P values were calculated by comparison of respective onset times by one-way ANOVA followed by Bonferroni’s post-hoc comparisons tests. *** p=0.0001, **** p<0.0001, ns=not significant.

