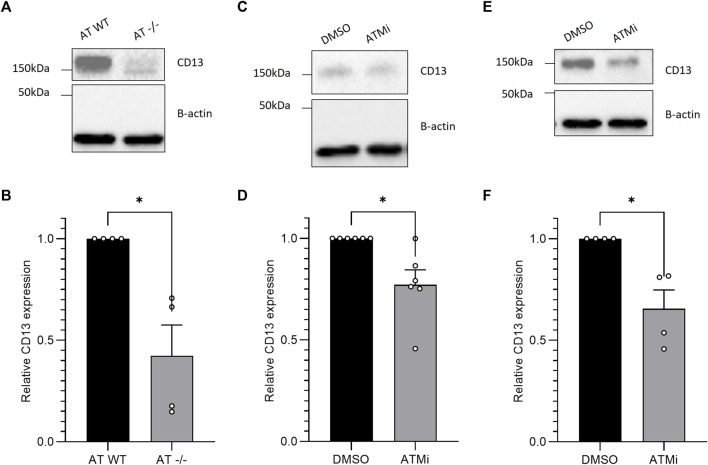
FIGURE 1.
Western blotting of CD13 expression in: (A) CD13 expression of AT cell lines pEBS-YZ5 (AT-WT) and ATM knockout pEBS (AT-/-) at baseline, then quantified in (B) (n = 4); (C) AT-WT cell line −/+ 10 μM ATM inhibition (ATMi) treatment for 16 h, quantified in (D) (n = 4); (E) SH-SY5Y cell line −/+ ATM inhibition treatment for 16 h, quantified in (F) (n = 4). Western blots quantified, SEM error bars. Unpaired t-test with Welch’s correction, *p < 0.05.

