FIGURE 3.
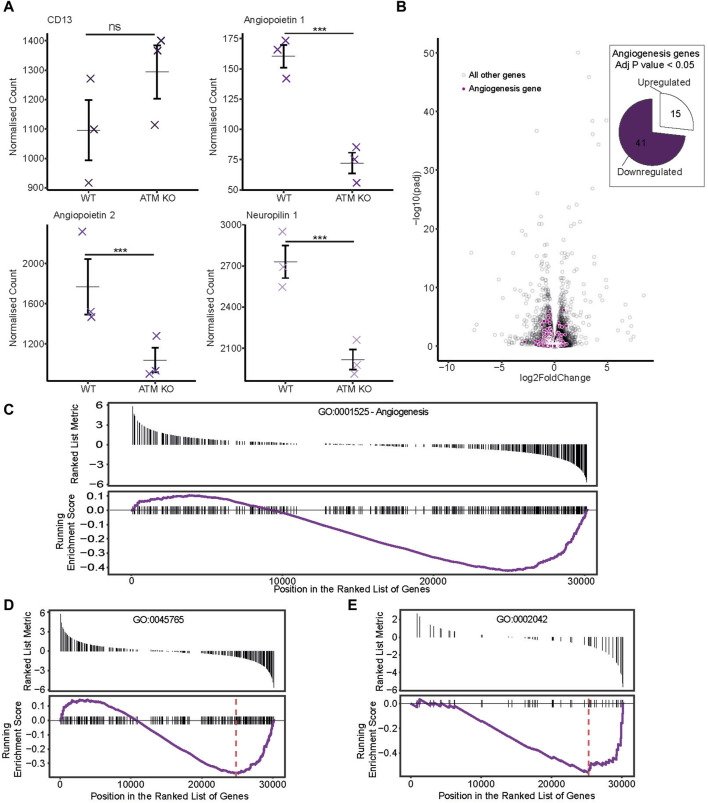
Publicly available RNAseq dataset from Hu et al. (2021) was sourced, whereby mice were injected with ATM proficient or deficient B16F10 melanoma cancer cells. (A) Normalized counts of genes potentially relevant to angiogenesis progression. Individual sample counts plotted as crosses with the mean represented by a horizontal bar and error bars showing ±1 standard error. (B) Differential expression of angiogenesis associated genes. In the volcano plot, genes corresponding to the Angiogenesis gene ontology term GO:0001525 are highlighted in purple. Those with a p score of less than 0.05 are represented as a proportion of genes either up or downregulated in the pie chart. (C–E) Gene set enrichment analysis was performed and genes for differing angiogenesis associated GO terms plotted with a ranked list metric showing log2 fold change scores in black and running enrichment score as the purple line. Maximum enrichment score is shown by the red dashed line. (C) shows scores for the Angiogenesis GO term GO:0001525. (D) For GO:0045765 regulation of angiogenesis and (E) GO:0002042 cell migration involved in sprouting angiogenesis.

