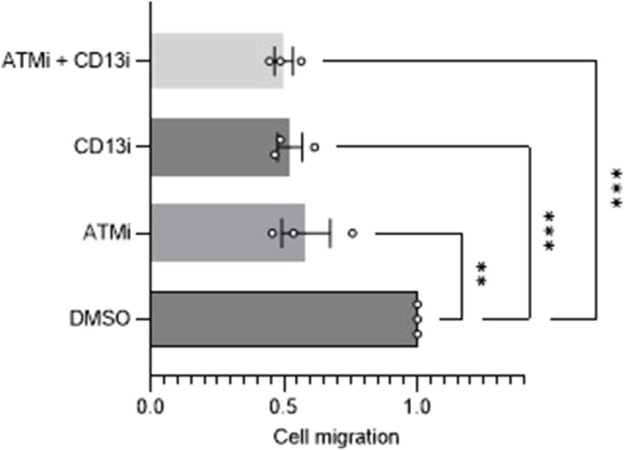
FIGURE 4.

Migration analysis of ATM and CD13 inhibition. Scratch assay analysis of cell migration after 24 h of cells treated with DMSO control, 10 uM ATMi, 100 uM CD13i or ATMi and CD13i in combination (n = 3). One-way ANOVA statistical analysis, **p < 0.01, ***p < 0.001. SEM error bars.
