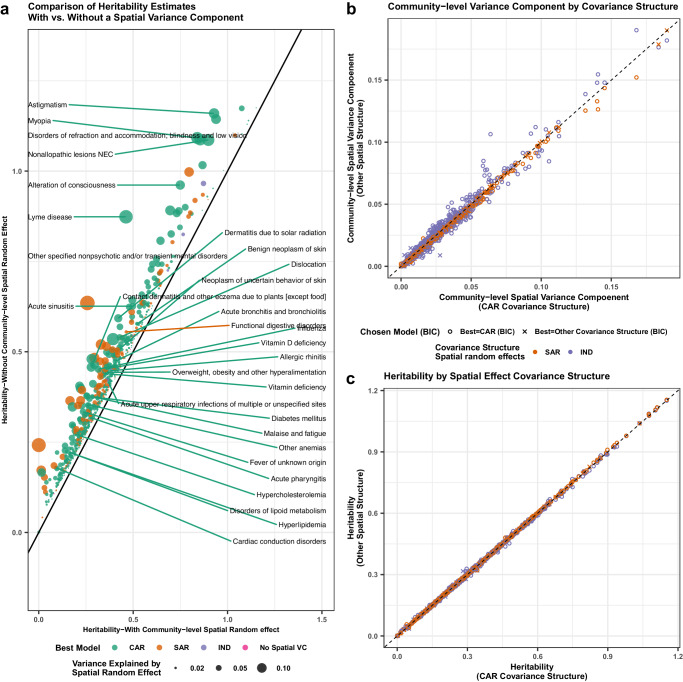
Fig. 3. Comparison of estimated heritability with and without accounting for community effects.
In a, we labeled the top 30 phenotypes with largest likelihood ratio increase after the addition of a community-location level spatial variance component. As expected from the theory, heritability estimates decrease on average by 4.3% after accounting for shared community-level environment. The models with the best BIC values are labeled and the size of the data points represents the magnitude of community-level environmental variance. In b and c, we compared variance estimates under independent normal distribution (IND), conditional autoregressive (CAR), and simultaneous autoregressive (SAR) covariance structures. We showed that regardless of the spatial covariance matrix used, (b) the spatial variance explained is very similar and (c) the estimated heritability is nearly identical.

