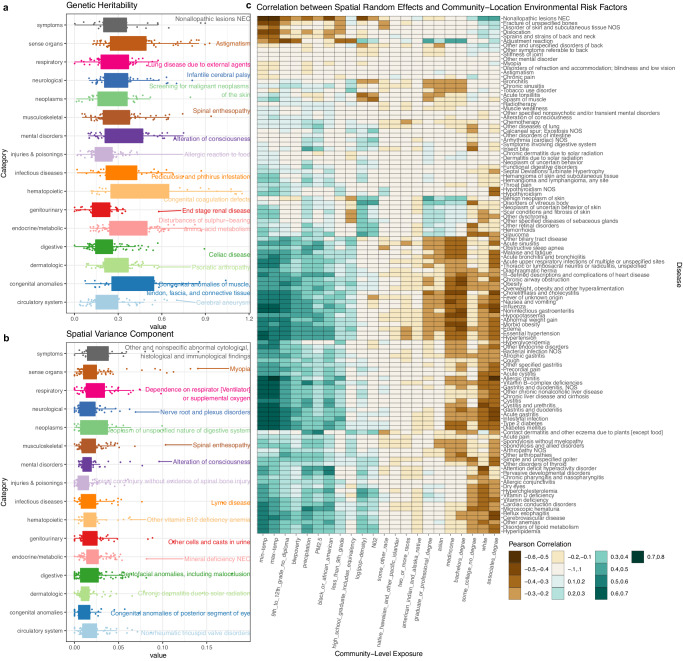
Fig. 4. Distribution of genetic and community effects by phenotype category.
Panels a and b show the distribution of heritability and community-level environmental variance component in each category of PheWAS disease code and the disease with the largest variance components is labeled for each category. Minima and maxima values (excluding outliers) are represented by the lower- and upper-bound of the whiskers. Median value is represented by the bold line in the middle. First and third quartiles are represented by the lower- and upper-bound of the box. Panel c displays heatmap of correlations between the best linear unbiased predictor (BLUP) of spatial random effects and each individual community location-level environmental exposure. Different colors in the plot indicate different ranges of Pearson correlation coefficient values. The number of phenotypes in each categories are the following: symptoms (n = 37), sense organs (n = 91), respiratory (n = 70), neurological (n = 63), neoplasms (n = 43), musculoskeletal (n = 91), mental disorders (n = 58), injuries & poisonings (n = 75), hematopoietic (n = 40), genitourinary (n = 55), endocrine/metabolic (n = 100), digestive (n = 117), dermatologic (n = 77), congenital anomalies (n = 38), and circulatory system (n = 79).

