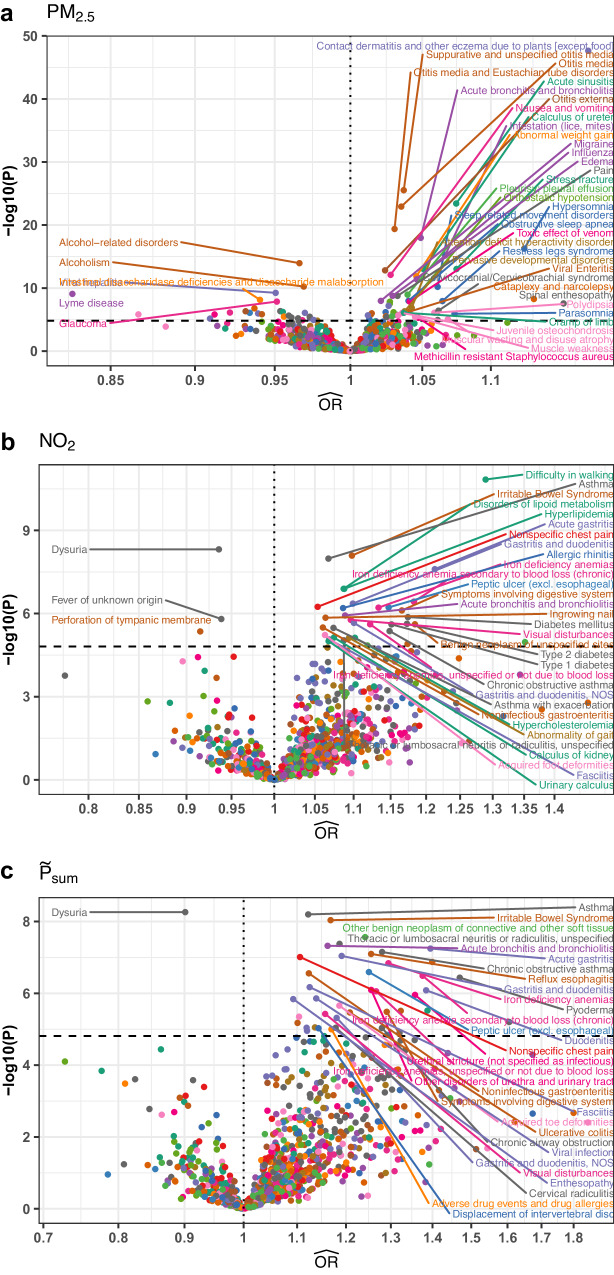
Fig. 5. Volcano plots of causal effect estimates from SMILE-2 model for pollution on diseases.
We plotted the estimated odds ratios against −log10(p-values) for the causal effects of (a) PM2.5, (b) NO2, and (c) the sum of the two pollutants (). All p-values are for two-sided hypothesis tests and are unadjusted for multiple comparisons. Dashed horizontal line represents Bonferroni significance threshold for testing 1083 diseases and three pollutants.

