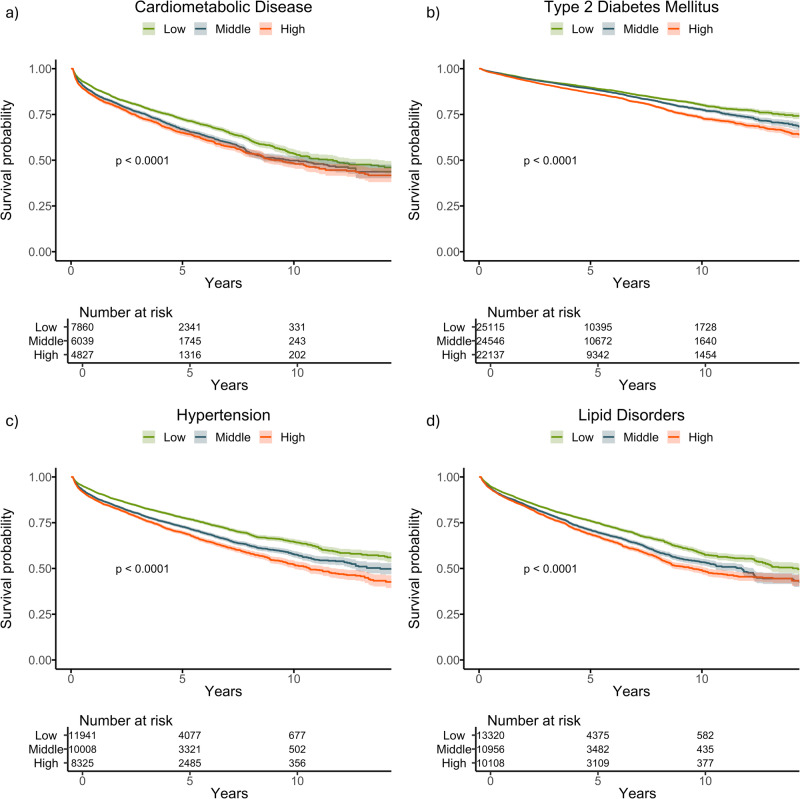
Fig. 2. Kaplan–Meier survival curves stratified by delta-BMI curves for future cardiometabolic outcomes in the BIDMC cohort.
Kaplan–Meier survival curves stratified by tertiles of delta-BMI in the BIDMC Cohort: Subplots a–d depict survival curves for cardiometabolic disease, type 2 diabetes mellitus, hypertension, and lipid disorders, respectively. Patients are stratified into tertiles based on delta-BMI, providing insights into the differential risk of each outcome. Log-rank p-values are reported for each outcome, highlighting statistically significant differences in survival across delta-BMI tertiles. Tertile cut-offs for delta-BMI are defined as follows: Bottom (delta-BMI ≤ −3.74), Middle (−3.74 to 2.44), and Top (>2.44).

