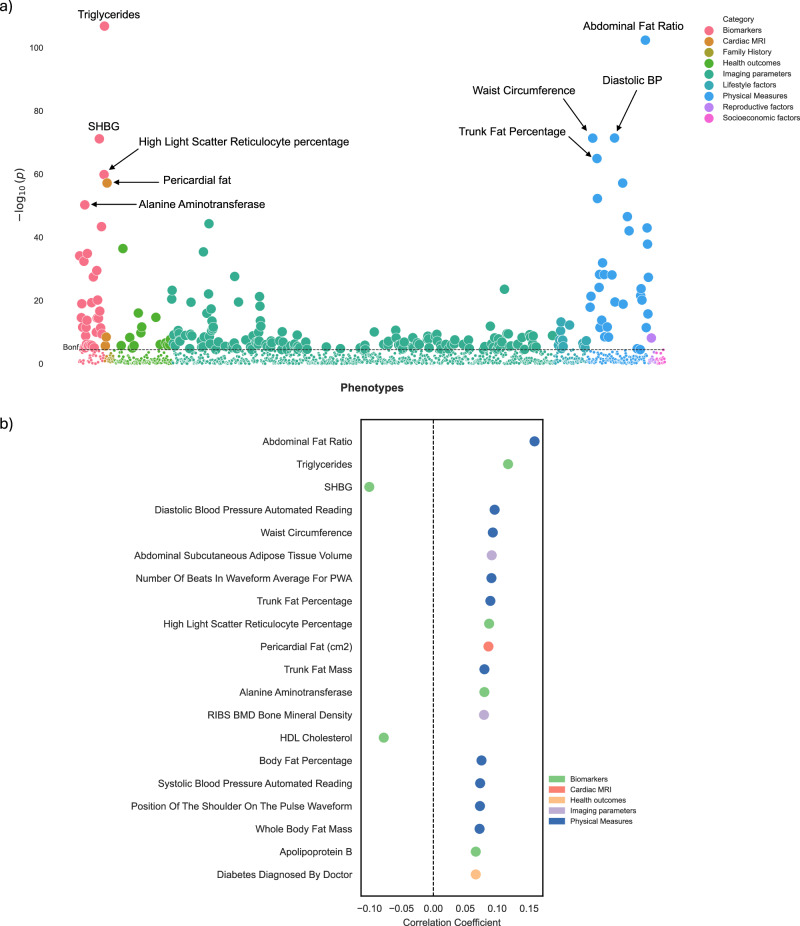
Fig. 5. Phenome-wide association study (PheWAS) of delta-BMI in the UK Biobank.
Exploration of the underlying biology through a phenome-wide association study (PheWAS) in the UK Biobank using clinical phenotypes: a A PheWAS Manhattan plot showing the negative logarithm of the univariate correlation p-values between delta-BMI and routinely recorded clinical features, adjusted for measured BMI, sex, age, and age2. The dashed horizontal line signifies the Bonferroni corrected threshold for multiple comparisons. Out of 1368 comparisons, 231 (16.9%) reached significance based on the Bonferroni correction, most of which came from imaging parameters, physical measures, and biomarkers. An interactive version of the plots can be accessed in the Online Supplement. b Illustrates the top 20 significant clinical phenotypes correlated with delta-BMI, presenting their respective correlation coefficients (Pearson). SHBG Sex Hormone Binding Globulin, PWA Pulse Wave Analysis, BP Blood Pressure, BMD Bone Mineral Density, HDL High-Density Lipoprotein.

