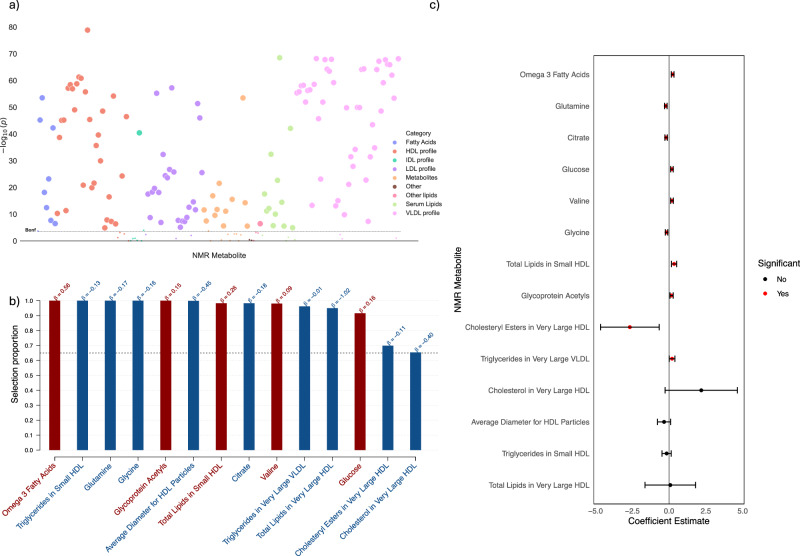
Fig. 6. Metabolomic analysis of delta-BMI variability.
Exploration of the underlying biology of delta-BMI variability using the UK Biobank NMR metabolomic data: a A metabolome-wide association study (MWAS) Manhattan plot showing the negative logarithm of the univariate correlation p-values between delta-BMI and the concentrations of NMR metabolites, adjusted for BMI, sex, age, and age2. Out of 168 comparisons, 136 (80.1%) reached significance based on the Bonferroni correction. An interactive version of the plots can be accessed in the Online Supplement. b Stability selection analysis employing LASSO regression on significant MWAS metabolites: This analysis, conducted over 1000 iterations with 80% subsampling, identifies robust metabolite associations with delta-BMI. Adjustments were made for measured BMI, sex, age, and age2. The black dashed line represents the calibrated selection proportion. c Multivariate linear regression analysis of stably selected metabolites against delta-BMI, adjusted for measured BMI, sex, age, and age2, demonstrating the individual contribution of stably selected metabolites to variations in delta-BMI.

