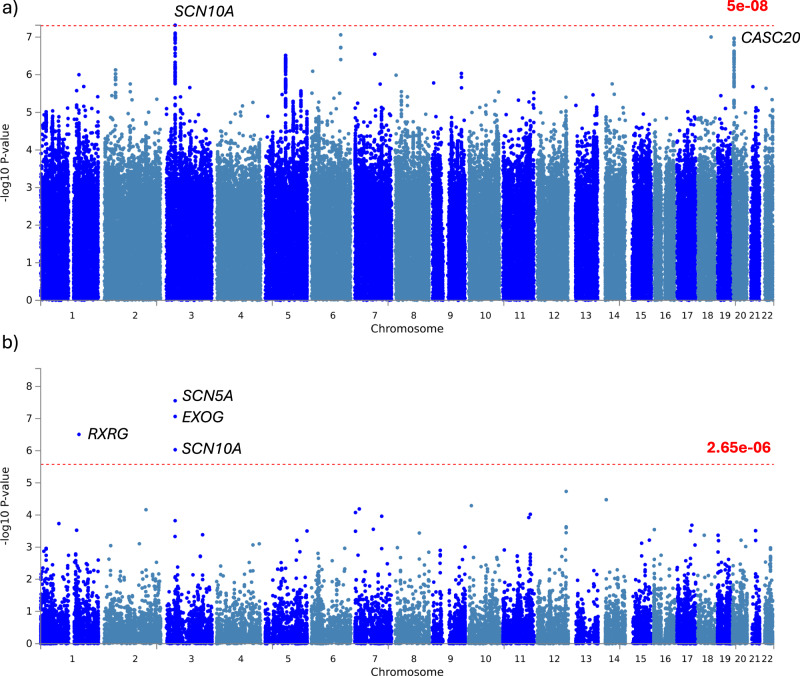
Fig. 8. Genome-wide association study (GWAS) of delta-BMI variability.
Exploration of the underlying biology of delta-BMI variability through a genome-wide association study (GWAS): GWAS Manhattan plots of genomic loci associated with delta-BMI. a Highlights the nearest genes associated with single nucleotide polymorphisms (SNP), with the red line depicting the genome-wide significant threshold (P < 5 ×10⁻⁸). b Displays a Manhattan plot derived from the gene-based test using MAGMA, mapping input SNPs to 18,882 protein-coding genes; the red line represents the genome-wide significant threshold (P < 2.65 ×10⁻⁶). SCN10A sodium voltage-gated channel alpha subunit 10, CASC20 cancer susceptibility 20, RXRG retinoid X receptor gamma, SCN5A sodium voltage-gated channel alpha subunit 10, EXOG exo/endonuclease G.

