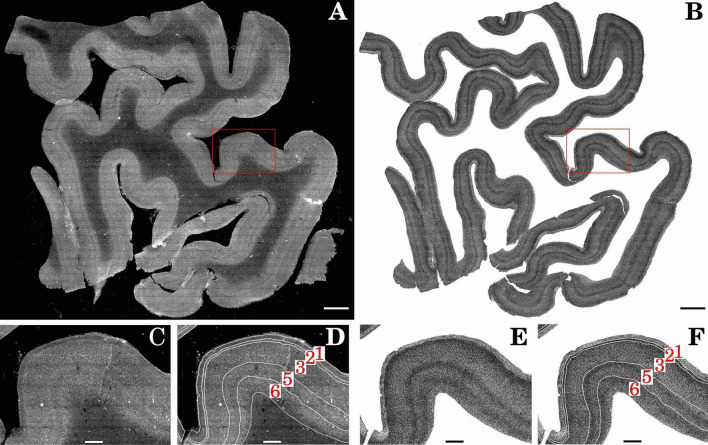
Figure 2.
DL predictions identify cell density changes between cortical layers. (A) Maximum intensity projection of slab 30. (B) Corresponding BCFind-v2 predictions. The highlighted region of interest (ROI) (C) without and (D) with layer contours on the raw data maximum intensity projections. The same ROI on the BCFind-v2 predictions (E) without and (F) with layer contours. Red numbers in panels D and F identify the cortical layers. Scale bars: 3 mm (A, B), 750 m (C–F).

