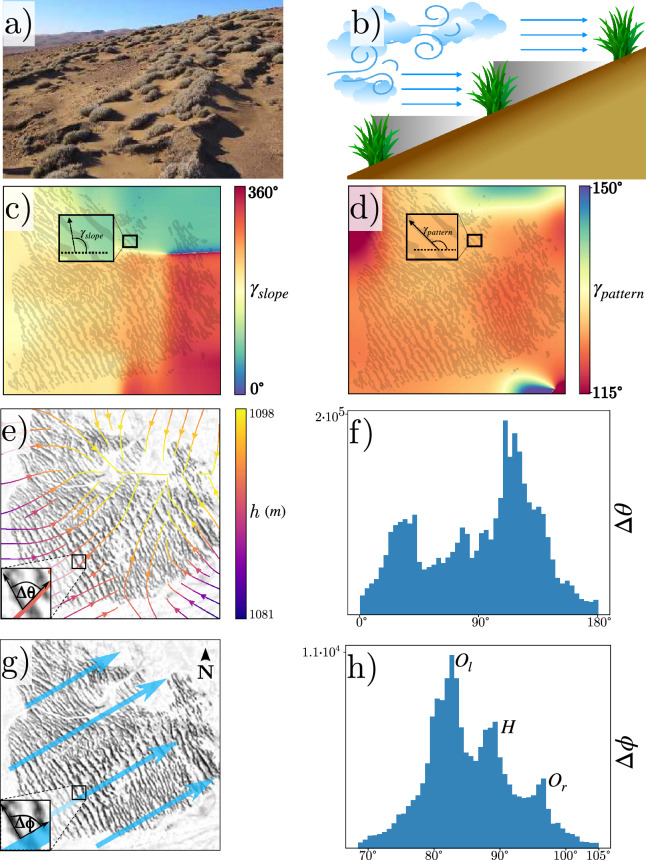
Figure 2.
Statistical analysis of Tillandsia landbeckii patterns alignment. (a) Photograph of Tillandsiales in the north of Chile (courtesy of Nicolás Lavandero, some rights reserved (CC BY https://creativecommons.org/licenses/by/4.0/)). (b) Schematic representation of nonreciprocal feedback for fog-dependent plants. (c) Slope orientation map of a vegetation pattern patch, where the colours show different orientations. The inset shows the angle generated by the slope gradient. (d) Angle of the banded pattern with respect to the east axis. The inset illustrates the angle, , which the banded pattern forms with respect to the horizontal axis. (e) Slope gradient streamlines for a patch of Tillandsia landbeckii. The colours in the curves account for the height h. stands for the angle between the vegetation band and the topography gradient. (f) distribution of the banded pattern and the direction of the slope. (g) Representation of the direction of fog propagation (wind) for a vegetation pattern patch. accounts for the orientation angle between the vegetation band and wind. (h) distribution histogram between wind direction and the vegetation banded pattern. , H, and account for the oblique left, horizontal, and oblique right pattern.

