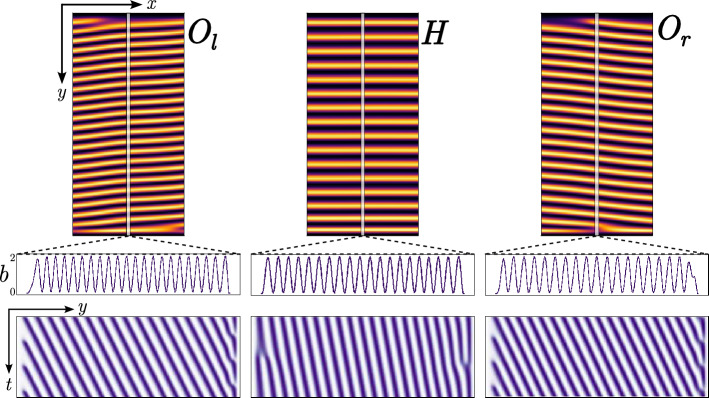
Figure 4.
Horizontal and oblique banded patterns obtained by numerical simulations of Eq. (2) with , , , , and . Columns , H, and show oblique banded patterns to the left clockwise, horizontal, and oblique banded patterns to the right counterclockwise, respectively. From top to bottom, the first row shows the 2D colour representation of the biomass field b(x, y, t). The second row is the biomass profiles b along the y direction at the central line, and the final row is the spatiotemporal evolution of these profiles, depicting the upward movement or advected patterns.

