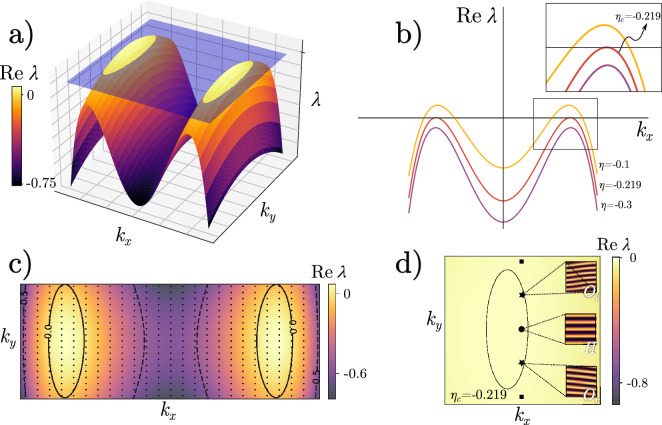
Figure 5.
Linear analysis close to the onset pattern formation. Panel (a) represents the Fourier space for , where the blue plane indicates . The condition for pattern formation is depicted in (b) as a projection; as increases towards a critical value , the curve surpasses the plane, allowing a band of unstable modes to appear. This region is shown in (c), where the discrete unstable modes, represented by dots, are within the solid line, while those outside satisfies . For , there are three unstable modes, as shown in (d), two obliques and , and the horizontal one H.

