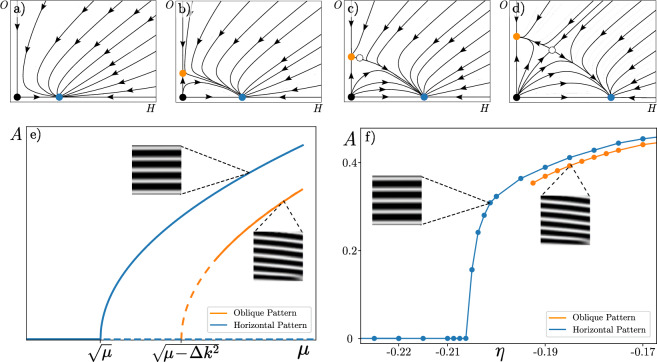
Figure 6.
Bifurcation diagram of horizontal and oblique banded vegetation patterns. The top row shows projections of the phase portrait for the oblique ( O) and horizontal ( H) banded patterns amplitudes. The uniform state corresponds to the origin of the phase portrait, which is represented by a black dot. The first pattern to arise is the horizontal one, depicted as the blue dot, emerging from the homogeneous state. Increasing the bifurcation parameter, , the oblique pattern (orange dot) emerges from the homogeneous state, as observed in (b). Note that, at first, this pattern is unstable, and through the appearance of the mixed pattern (white dot), the pattern becomes stable, as shown in (c). As a result, (d) illustrates the full phase space for the oblique and horizontal banded pattern amplitudes. This dynamic is represented in panel (e) as a bifurcation diagram. Moving forward , first arises the horizontal pattern in a supercritical way (blue curve), then the oblique pattern emerges supercritically. The solid and dashed lines account for stable and unstable states. The panel (f), is the bifurcation diagram obtained by numerical simulation of Eq. (2) by , , , and , showing the same behaviour of panel (e).

