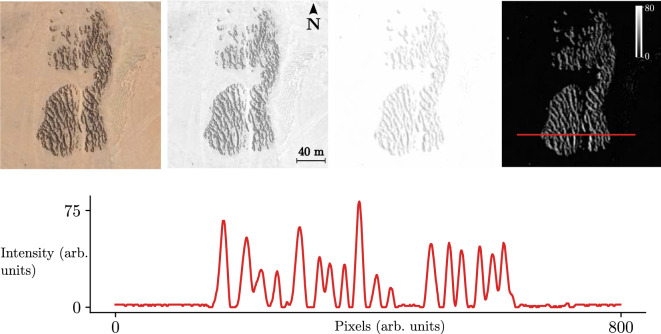
Figure 7.
Tillandasia landbeckii vegetation patterns. From left to right of the top panels, the first panel is a satellite image from Tillandsia patches. The next one corresponds to the same picture but in greyscale. A Gaussian filter was used to smooth the pattern for the third image, and the background was removed. As a result, we obtain the last panel, but the greyscale is inverted. The bottom panel shows a horizontal spatial profile of the Tillandsia landbeckii pattern highlighted in the red line on the right top panel; the peaks account for biomass, and the minimums are bare soil.

