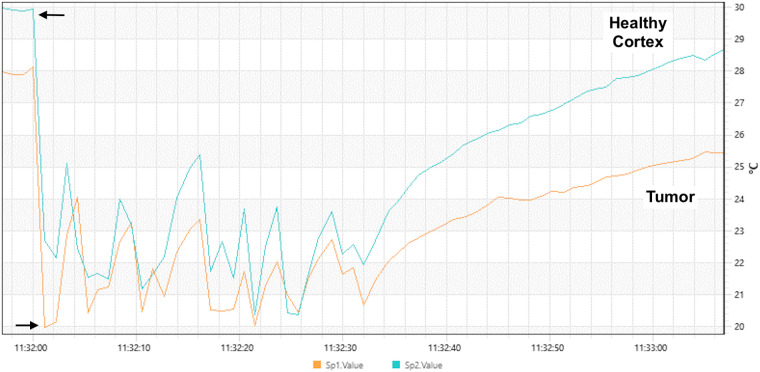
Figure 3.
Temperature profiles were obtained from more than 100 images during saline irrigation. Arrows demonstrate the beginning and the end of irrigation. After evaporative cooling, thermal recovery curves were different between the healthy cortex (blue line in the graph) and tumor area (orange line in the graph). Note that the temperature recovery is slower in the tumoral area lesion and reaches a significantly lower temperature compared to the healthy cortex.

