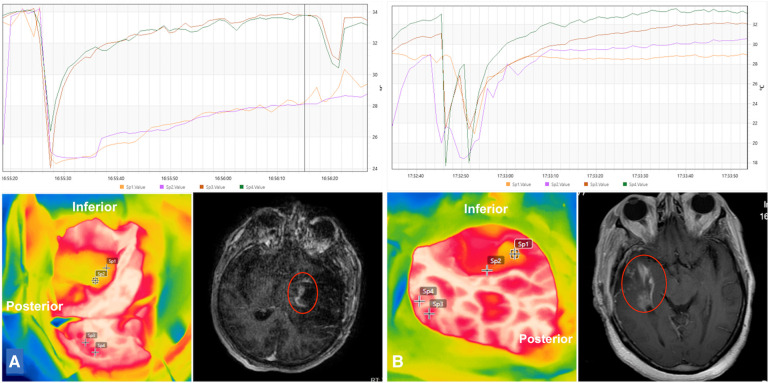
Figure 4.
Intraoperative infrared thermographic imaging of the tumor beds of two temporal glioblastomas (A,B; lower left). Suspected areas of delayed temperature recovery curves were marked and correlated to postoperative imaging. Residual tumoral areas thermographic profiles demonstrated similar thermal recovery curves of tumoral areas obtained before tumor resection, namely steady and slow temperature recovery and lower final temperature (orange and purple lines in graphs) in comparison to the healthy cortex (dark orange and green lines in graphs) (A,B; upper row). Postoperative gadolinium-enhanced T1-weighted images demonstrated residual tumors at the tumor beds (A,B; lower right).

