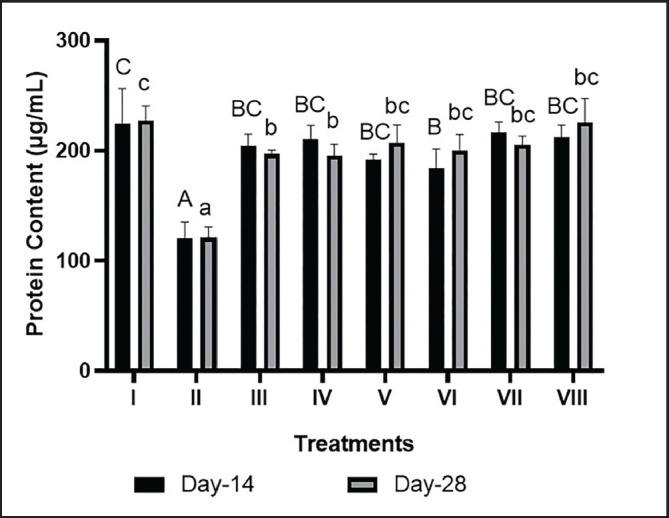
Fig. 6. Effects of BPE on protein content in DM and Dyslipidemia Rats. * The data are shown as mean ± standard deviation from 4 repetitions. Different superscript marks A, B, BC, and C on protein content day 14 (μmol/l) and a, b, bc, and c on protein content day 28 (mmol/l) showed significant differences (p < 0.05). Group I: negative control (aquadest), Group II: positive control (HFD, PTU, STZ 60 mg/kg BW, NA 120 mg/kg BW), Group III: Positive control + BPE 200 mg/kg BW/day, Group IV: Positive control + BPE 400 mg/kg BW/day, Group V: Positive control + BPE 800 mg/kg BW/day, Group VI: Positive control + Simvastatin 0.9 mg/kg BW, Group VII: Positive control + Glibenclamide 0.45 mg/kg BW, Group VIII: positive control + Glibenclamide 0.45 mg/kg BW + Simvastatin 0.9 mg/kg BW.

