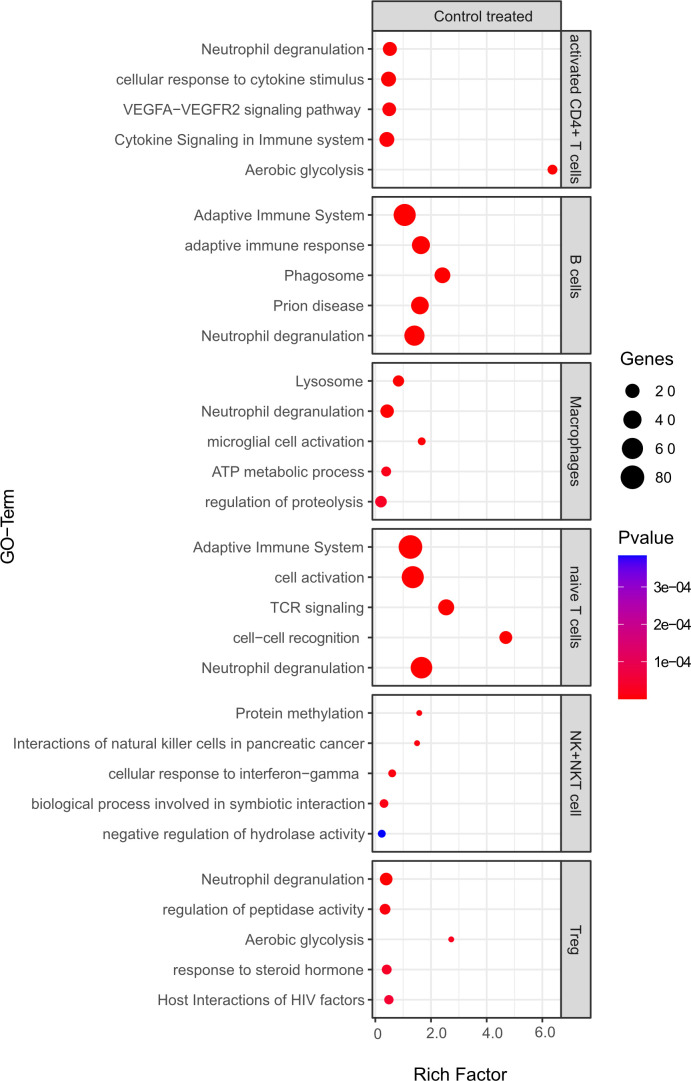
Figure 10.
Functional enrichment analysis for genes differentially expressed between mELT from control treated mice and CSF from control treated mice using Metascape. The top 5 GO-terms are shown. For similar gene ontology (GO) terms, only the top-ranked GO term was shown. The dot size reflects the number of genes enriched in the GO term and its color the corresponding statistical significance (p-value). Rich factor is the ratio of differentially expressed gene numbers annotated in this GO term to all gene numbers annotated in this GO term.

