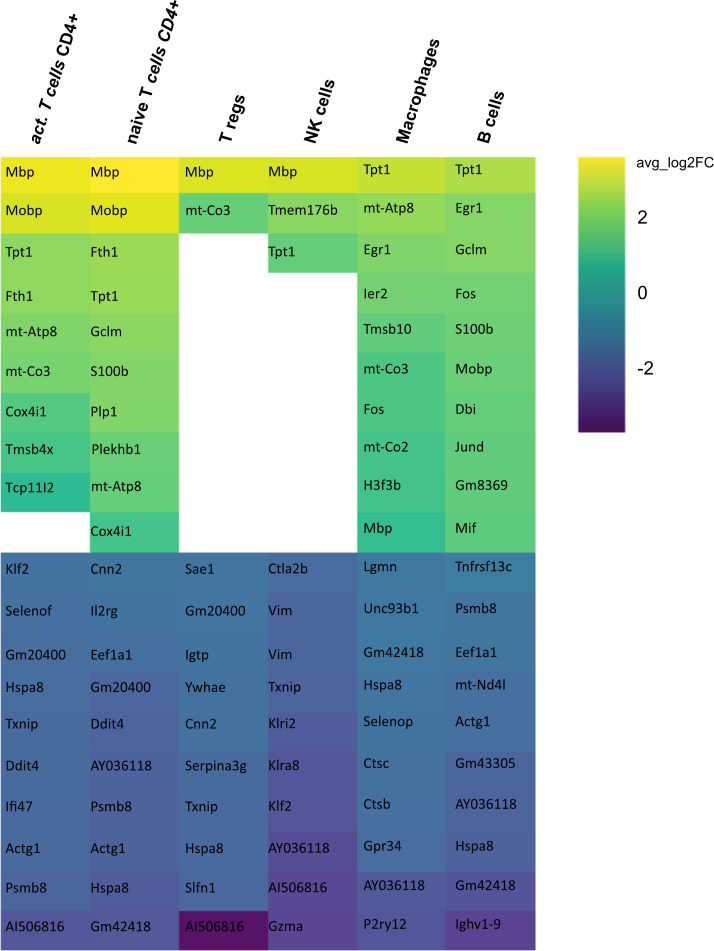
Figure 7.
Heatmap representing differentially expressed genes (DEGs) between mELT from control treated and CSF from control treated mice for each cell type. Gene analysis was conducted only for cell counts >50. Thus, not all cell types are shown. The top 10 up- and downregulated genes in mELT from control treated mice when compared to CSF from control treated mice are shown. Genes were ranked according to average log2 fold-change (avg_log 2FC). Positive avg_log 2FC represent upregulated genes in mELT from control treated mice (green), negative values correspond to downregulated genes (blue).

