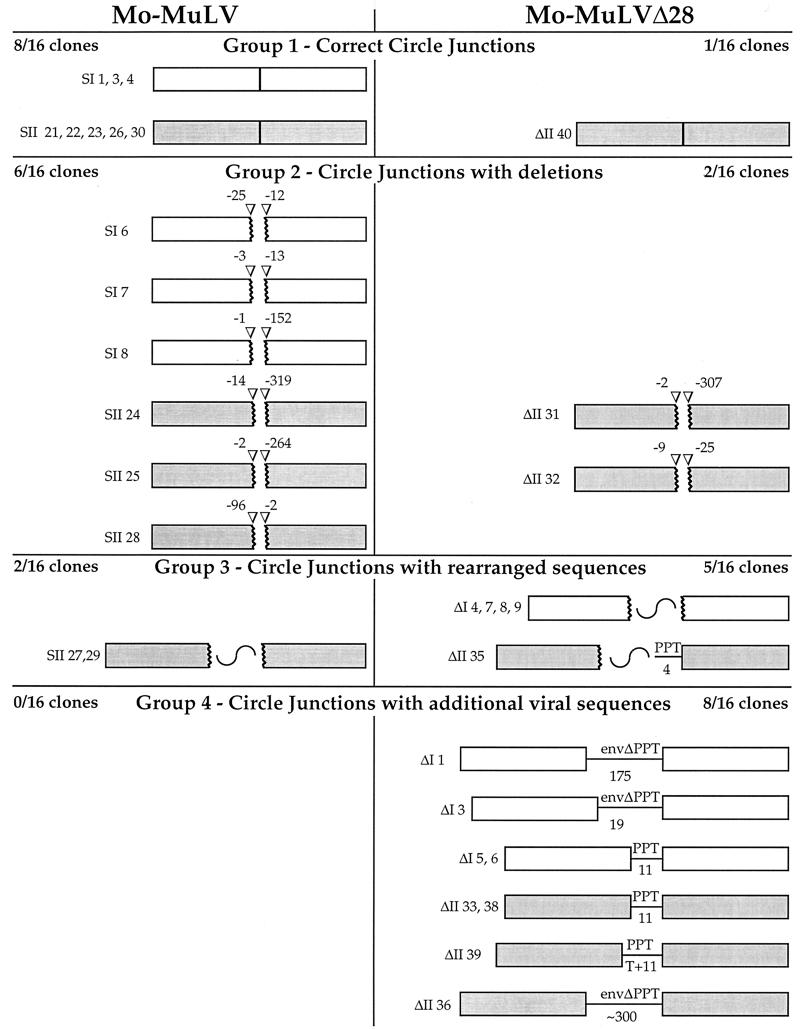
FIG. 6.
Schematic representation of LTR-LTR circle junction analysis. Boxes represent LTRs. White and gray boxes represent clones obtained from two separate experiments. Broken boxes represent LTRs with truncations. The number of bases missing from the edge of the LTRs is shown above arrowheads. Broken boxes with a wavy line represent truncated LTRs with inserts of rearranged plasmid or unidentified sequences. Straight lines represent viral sequences retained at the LTR-LTR junction. The number of base pairs in these retained sequences is indicated below the line. T+11, an untemplated T plus 11 bp.

