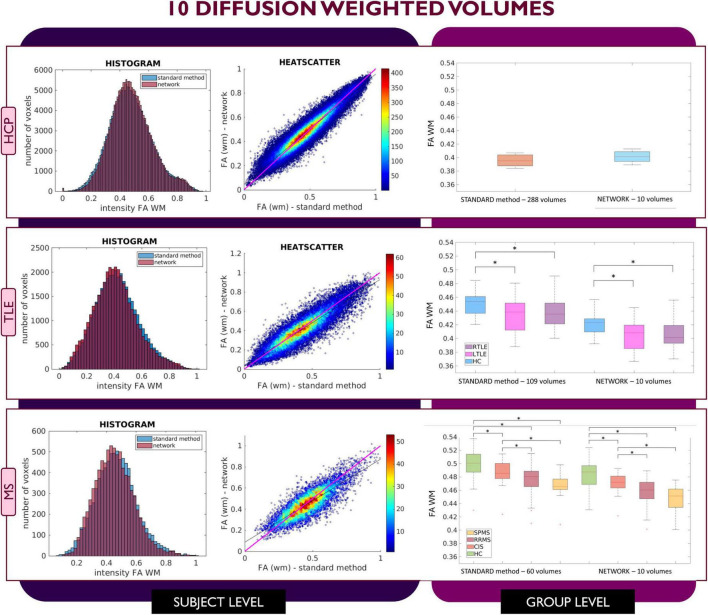
FIGURE 4.
Comparison of the white matter (WM) fractional anisotropy (FA) for the experiment using 10 diffusion weighted (DW) volumes. Each row shows a different dataset, from top to bottom: human connectome project (HCP), temporal lobe epilepsy (TLE) and multiple sclerosis (MS). From left to right, columns show histograms, heatscatter plots and boxplots of WM FA (normal appearing WM—NAWM—for the MS case). Significant differences between clinical groups are indicated in the boxplots with an asterisk.

