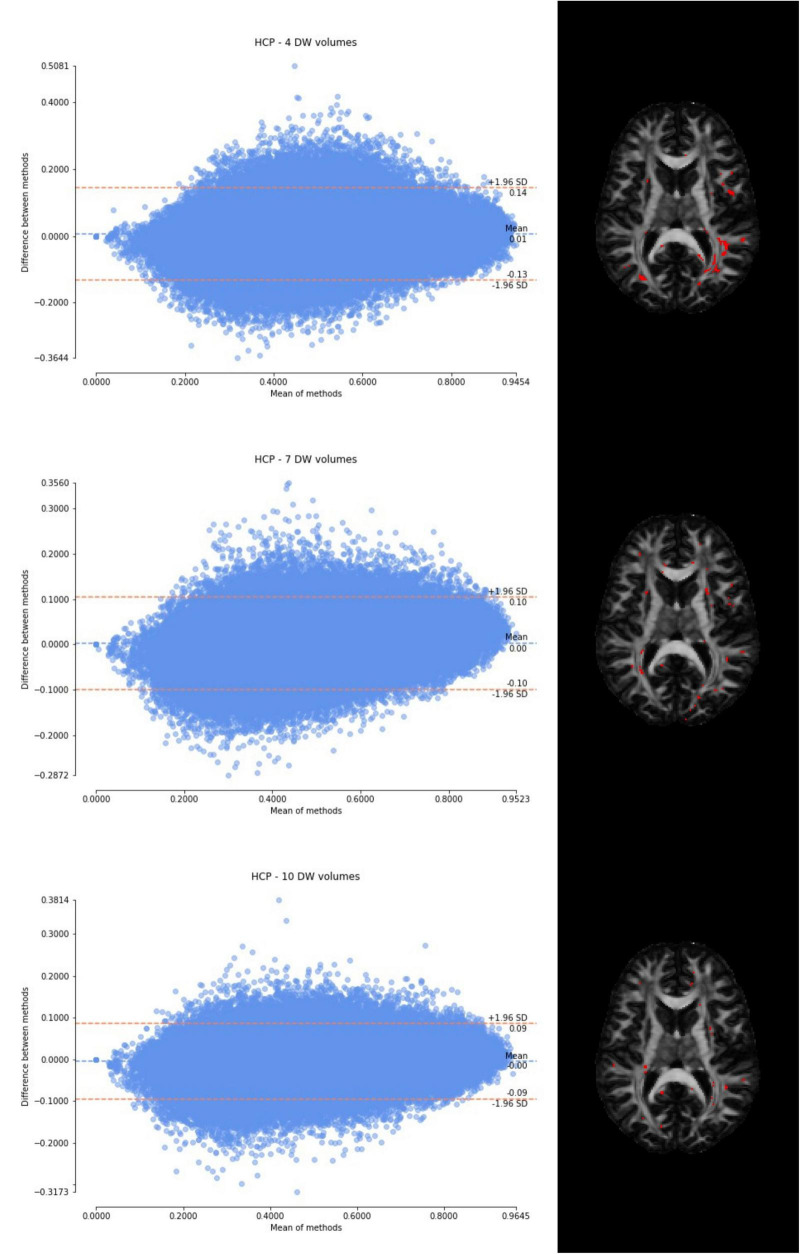
FIGURE 5.
From top to bottom, for a randomly chosen HCP test subject, Bland–Altman plots of all WM FA voxels are shown, with increasing the number of diffusion-weighted (DW) volumes given in input to the deep learning network, i.e., from 4 to 10. On the right, an axial image of the brain shows the location of the outliers (red voxels).

