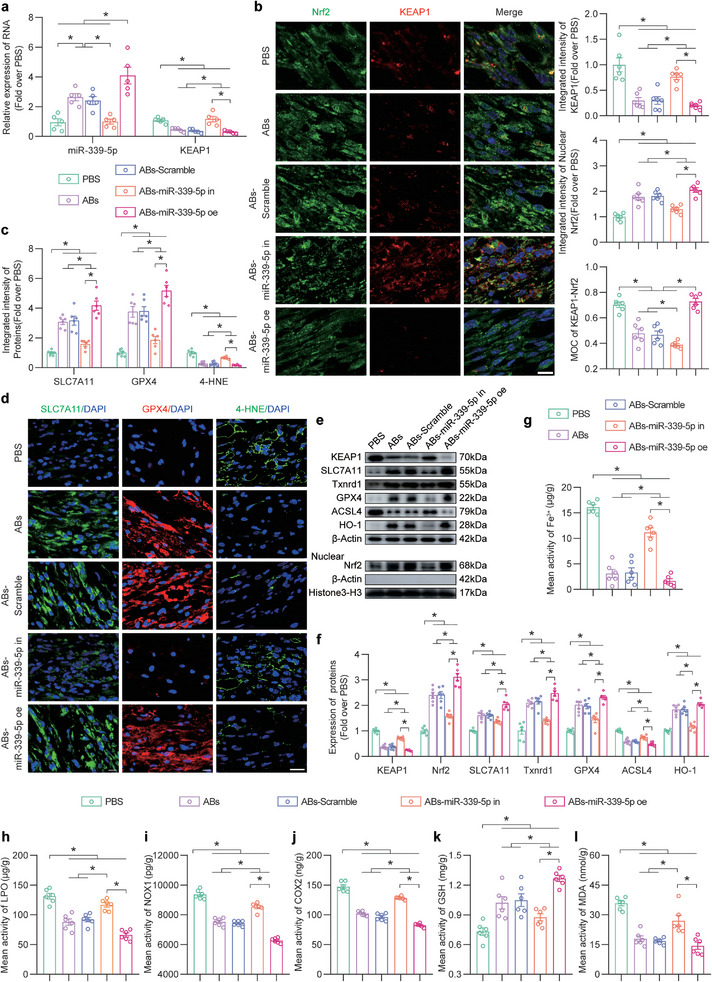
Figure 8.

ABs inhibited ferroptosis in ischaemic skin flaps via the miR‐339‐5p/KEAP1 axis. a) Comparison of the relative expression levels of KEAP1 and miR‐339‐5p in the skin in the five groups on POD7 (n = 5). b) IF staining of KEAP1 and Nrf2 in FLAP area II in the five groups on POD7. Scale bar: 10 µm. The integrated intensity of KEAP1 (top) and nuclear Nrf2 (mid) and the MOC for KEAP1‐Nrf2 (bottom) in the dermal layer of the five groups were quantified (n = 6). c) Quantified integrated intensity of SLC7A11, GPX4 and 4‐HNE in the dermal layer in the five groups (n = 6). d) IF staining of SLC7A11, GPX4 and 4‐HNE in FLAP area II in the five groups on POD7. Scale bars: 10 µm and 20 µm (4‐HNE). e) KEAP1, nuclear Nrf2 and ferroptosis‐related protein levels in FLAP area II in the five groups on POD7. f) Comparison of the expression levels of KEAP1, nuclear Nrf2 and ferroptosis‐related proteins in the skin in the five groups. β‐Actin and Histone 3‐H3 served as loading controls and for band density normalization, respectively (n = 6). g) Quantification of the iron levels in area II of the FLAP in the five groups (n = 6). h‐j) ELISA analysis of LPO (h), NOX1 (i) and COX2 (j) levels in area II of the flap in the five groups on POD7 (n = 6). k,l) GSH (k) and MDA (l) levels in area II of the flap in the five groups on POD7 (n = 6). The error bars are the SEMs. Significance (*): p value < 0.05; ANOVA plus the LSD post hoc test (equal variances) or Dunnett's T3 method (unequal variances).
