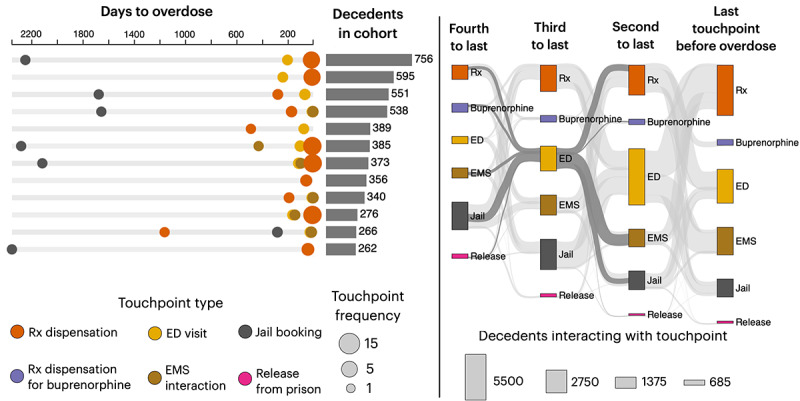
Figure 1.

A total of 2 initial visual representations of touchpoints in Indiana (aggregate data from 2015 to 2022). On the left, a timeline-based visualization illustrates the cohorts of decedents with distinct sequences of touchpoints. The visualization depicts the average number of days to fatal overdose (circle position) and frequency of interaction with a touchpoint (circle diameter). For example, the first row shows 756 individuals who experienced a jail booking approximately 6 years before overdose, followed by a sequence of emergency department (ED) visits and medical prescription (Rx) dispensations, the last of which typically occurred approximately 200 and 90 days before overdose, respectively. A Sankey diagram (right) displays the temporal ordering of (up to 4) touchpoints but without showing durations. EMS: emergency medical services.
